Performance and interface et al
Contents
- Performance issues
- Preparation
- Basic interface ops
- Performance configurations
- Buffering
- Hash chain table size, hash autopilot, hash functions
- Flow timeout and flow duration
- Verbose
- Packets/flow distribution
- Dissector optimization
- BPF filtering
- Binary output
- Plugins and configuration
- Parallelization
- Conclusion
Performance issues
Running T2 on an interface can be achieved by using the -i command line option.
Nevertheless, you might face problems with certain memory, OS or library peculiarity,
e.g. libpcap. So you might also need input buffering and flow timeout controls, which
we will discuss in this tutorial. The discussed performance enhancements are also
pertaining to operations on large pcaps.
Preparation
First, restore T2 into a pristine state by removing all unnecessary or older plugins from the plugin folder ~/.tranalyzer/plugins:
t2build -e -y
Are you sure you want to empty the plugin folder '/home/wurst/.tranalyzer/plugins' (y/N)? yes
Plugin folder emptied
Then compile the core (tranalyzer2) and the following plugins:
t2build tranalyzer2 basicFlow basicStats tcpStates txtSink
...
BUILD SUCCESSFUL
If you did not create a separate data and results directory yet, please do it now in another bash window, that facilitates your workflow:
mkdir ~/data ~/results
Now you are all set!
Basic interface ops
In order to collect flows from any interface you need to become root, the command st2 will
help you out:
cd ~/results st2 -i interface -w -
[sudo] password for user:
...
The -w - option is used to dump the flow output to stdout.
You could pipe that output now into a netcat and send it somewhere.
If you invoke t2stat -s in another window you will
see the statistics on the interface: (Note that the flow time is set by default at 3 min, so you see not many flows at the beginning. We will explain the
control of flow timeouts in the Flow timeout and flow duration chapter below.)
Open a socket to receive the flow output:
nc -l 127.0.0.1 -p 6666
On another terminal, pipe the output of t2 to a socket:
st2 -i interface -w - | nc 127.0.0.1 6666
[sudo] password for wurst:
...
Your receiving socket should see something like this below:
%dir	flowInd	flowStat	timeFirst	timeLast	duration	numHdrDesc	numHdrs	hdrDesc	srcMac	dstMac	ethType	ethVlanID	srcIP	srcIPCC	srcIPOrg	srcPort	dstIP	dstIPCC	dstIPOrg	dstPort	l4Proto	numPktsSnt	numPktsRcvd	numBytesSnt	numBytesRcvd	minPktSz	maxPktSz	avePktSize	stdPktSize	minIAT	maxIAT	aveIAT	stdIAT	pktps	bytps	pktAsm	bytAsm	tcpStatesAFlags

                                    @      @
                                     |    |
===============================vVv==(a    a)==vVv===============================
=====================================\    /=====================================
======================================\  /======================================
                                       oo
USR1 A type report: Tranalyzer 0.9.2 (Anteater), Cobra. PID: 3586
PCAP time: 1643723808.956691 sec (Tue 01 Feb 2022 13:56:48 GMT)
PCAP duration: 19.064731 sec
Time: 1643723809.861959 sec (Tue 01 Feb 2022 14:56:49 CET)
Elapsed time: 20.504374 sec
Number of packets received: 91 [100.00%]
Number of processed packets: 86
Number of processed bytes: 6526 (6.53 K)
Number of raw bytes: 6526 (6.53 K)
Number of pad bytes: 70
Number of IPv4 packets: 54 [62.79%]
Number of IPv6 packets: 22 [25.58%]
Number of A packets: 73 [84.88%]
Number of B packets: 13 [15.12%]
Number of A bytes: 5629 (5.63 K) [86.25%]
Number of B bytes: 897 [13.75%]
Average A packet load: 77.11
Average B packet load: 69.00
--------------------------------------------------------------------------------
--------------------------------------------------------------------------------
Headers count: min: 3, max: 4, average: 3.02
Number of LLC packets: 10 [11.63%]
Number of ICMPv6 packets: 3 [3.49%]
Number of TCP packets: 35 [40.70%]
Number of TCP bytes: 2460 (2.46 K) [37.70%]
~~~~~~~~~~~~~~~~~~~~~~~~~~~~~~~~~~~~~~~~~~~~~~~~~~~~~~~~~~~~~~~~~~~~~~~~~~~~~~~~
Number of processed   flows: 17
Number of processed A flows: 11 [64.71%]
Number of processed B flows: 6 [35.29%]
Number of request     flows: 11 [64.71%]
Number of reply       flows: 6 [35.29%]
Total   A/B    flow asymmetry: 0.29
Total req/rply flow asymmetry: 0.29
Number of processed   packets/flows: 5.06
Number of processed A packets/flows: 6.64
Number of processed B packets/flows: 2.17
Number of processed total packets/s: 4.51
Number of processed A+B   packets/s: 4.51
Number of processed A     packets/s: 3.83
Number of processed   B   packets/s: 0.68
~~~~~~~~~~~~~~~~~~~~~~~~~~~~~~~~~~~~~~~~~~~~~~~~~~~~~~~~~~~~~~~~~~~~~~~~~~~~~~~~
Number of average processed flows/s: 0.89
Average full raw bandwidth: 2738 b/s (2.74 Kb/s)
Average full bandwidth : 2487 b/s (2.49 Kb/s)
Fill size of main hash map: 17 [0.01%]
Max number of flows in memory: 17 [0.01%]
Memory usage: 0.02 GB [0.03%]
Aggregated flowStat=0x0c0000000000c004
[INF] Layer 2 flows
[INF] IPv4 flows
[INF] IPv6 flows
================================================================================
...
This is a line which has 2.74 Kb/s on the average. So almost nothing. Now let’s assume that you have a 10+ GBit line. As T2 has basically a lean single threaded packet collector, there is a limit on interface operation. It can be extended, but to go beyond 10 GBit is currently difficult single threaded. Nevertheless, there will be a parallelized version, which then can consume more traffic but also more memory and will not be able to do some of the wonderful things, such as interwork L4 with L3 information as in connStat.
So always look at the Fill size of main hash map, Max number of flows in memory and Memory usage values.
It becomes vital when the -c option is used for several T2 on different cores on several interfaces, e.g.
behind a regeneration tap. Another way of parallelization.
Then you need to select the amount of plugins and their config carefully,
or you increase your memory bank. Nevertheless, T2 also works on old low performance or embedded HW, therefore
it is tuneable down to very bit.
Hence, in the following all the options to make Anteater faster will be discussed.
Performance configurations
Most of practitioners only want a monitoring or a simple flow aggregation as defined in NetFlow 5-7 or have almost no boundaries on the memory. Then there are several method to influence the performance of T2 in time and memory:
| Issue | Parameter | File | Tutorial |
|---|---|---|---|
| Core traffic Peaks | LIVEBUFSIZE, -B option |
tranalyzer.h | |
| Short flows, high # flow/s | LIVEBUFSIZE, -B/-c/-P options, socketSink |
tranalyzer.h | |
| # of flows in memory | HASH*, -f option, T2_HASH_FUNC |
hashTable.h, tranalyzer.h | |
| Flow memory limitations | FLOW_TIMEOUT |
tranalyzer.h | Flow timeout control |
| Maximum flow release time | FDURLIMIT |
tranalyzer.h, | Flow timeout control |
| Redirect output, block buffer | BLOCK_BUF |
tranalyzer.h | |
| Remove clutter | VERBOSE |
tranalyzer.h | |
| Binary output: binSink | GZ_COMPRESS |
binSink.h | |
| # and configuration of plugins | s.plugin doc | ||
| Parallelization (DPDK) | Parallelization (DPDK) |
All theses files reside under the src/ directory of T2 core, so move to it.
tranalyzer2
ls src/
binaryValue.c  flow.c  global.h  hashTable.c  hdrDesc.c  ioBuffer.c  loadPlugins.c  main.c  Makefile.am       outputBuffer.c  packetCapture.c  packet.h  tranalyzer.h
binaryValue.h  flow.h  hash      hashTable.h  hdrDesc.h  ioBuffer.h  loadPlugins.h  main.h  networkHeaders.h  outputBuffer.h  packetCapture.h  proto
In the following we will look at these files and discuss the different options.
Buffering
So let’s look at the buffering:
vi src/tranalyzer.h
Since version 0.9.1 the former used IO_BUFFER is obsolete as the queue is not as performant
as the libpcap buffer. Open tranalyzer.h and look for LIVEBUFSIZE:
...
#define LIVEBUFSIZE 0x1fffffff // libpcap buffer size for live capture
...
The default size is: 536MByte You may reduce it if you have an older computer.
You can increase it up to 0x7fffffff, ca 1GByte. To make your life easier, we introduced
the -B command line option which overwrites LIVEBUFSIZE, so no recompile is necessary.
You can use either hex or decimal input.
st2 -i interface -w - -B 100000
Or if you want it persistent:
t2conf tranalyzer2 -D LIVEBUFSIZE=100000
Hash chain table size, hash autopilot, hash functions
The Anteater keeps all flow information and the ones of the plugins in memory until
a flow timeouts, then he reuses the so called flow bucket. The number of flow buckets
if defined in tranalyzer.h by the constant HASHCHAINTABLE_BASE_SIZE.
If chosen as multiple of two, makes the hash very performant, as the modulo becomes a simple bitwise &.
The required hash space to address the buckets is defined by HASHTABLE_BASE_SIZE and in order to avoid hash
collisions it is good practice to choose this value eight times the flow buckets amount, as indicated in the listing below.
The multiplication factor depends on the type of traffic, so the factor used in T2 is good practice according to our experience. You may increase the ration between hash buckets and hash space, but then you will use a bit more memory. It is a trade off and depends on the type of HW you are using.
Now open tranalyzer.h and search for HASHTABLE_BASE_SIZE.
vi src/tranalyzer.h
...
// The sizes of the hash table
#define HASHFACTOR        1 // default multiplication factor for HASHTABLE_BASE_SIZE if no -f option
#define HASH_CHAIN_FACTOR 2 // default multiplication factor for HASHCHAINTABLE_BASE_SIZE

#define HASHCHAINTABLE_BASE_SIZE 262144UL // 2^18
#define HASHTABLE_BASE_SIZE      (HASHCHAINTABLE_BASE_SIZE * HASH_CHAIN_FACTOR)

#define HASH_AUTOPILOT 1 // 0: disable hash overrun protection
                         // 1: avoids overrun of main hash, flushes oldest NUMFLWRM flow on flowInsert
#define NUMFLWRM       1 // number of flows to flush when main hash map is full

/* ========================================================================== */
/* ------------------------- DO NOT EDIT BELOW HERE ------------------------- */
/* ========================================================================== */
...
You may choose these values as you wish, if you do not want to optimize run time
performance, as on an interface or when dealing with very large pcaps. Note
that the compiler, HW and the memory layout is also a factor, then a large increase
of the HASH_CHAIN_FACTOR can be non beneficial. If you don’t want to
edit .h files here are the commands to enlarge it by a factor of 4.
t2conf tranalyzer2 -D HASH_CHAIN_FACTOR=4 && t2build tranalyzer2
To increase the amount of flow hash space and the hash as well the HASHFACTOR
has to be changed. To make your life easier we added the -f option in the command line, which overwrites
HASHFACTOR and multiplies both hash constants with the f value you supply.
If you want to test it on your interface the command line would be:
st2 -i interface -w - -f 8
[sudo] password for wurst:
...
You can also try it on one of our pcaps.
If t2 runs out of hash buckets, because you underestimated the number of flows in a pcap,
or on an interface, the hash autopilot automatically removes the oldest NUMFLWRM
flows, reports the required hash factor and continues.
This survival function avoids a rerun if the pcap is very large. So you get a result and
for the next pcap or start on the interface you can change the proposed hash factor in the -f option.
If performance is too low then look first in the T2 end report at the following lines
Max number of flows in memory: 70051 (70.05 K) [26.72%]
Memory usage: 0.18 GB [0.26%]
If the first is above 30% and the second below 40% you may increase the number of HASH space and flow memory by a large factor to avoid hash collisions. Otherwise try it by a factor of 2 steps.
There is another last resort, the hash function. T2 provides a choice of several hash functions
in hashTable.h. Look for T2_HASH_FUNC.
vi src/hashTable.h
...
/* ========================================================================== */
/* ------------------------ USER CONFIGURATION FLAGS ------------------------ */
/* ========================================================================== */

#define T2_HASH_FUNC      10 // Hash function to use:
                             //   0: standard
                             //   1: Murmur3 32-bits
                             //   2: Murmur3 128-bits (truncated to 64-bits)
                             //   3: xxHash 32-bits
                             //   4: xxHash 64-bits
                             //   5: XXH3 64-bits
                             //   6: XXH3 128-bits (truncated to lower 64-bits)
                             //   7: CityHash64
                             //   8: MUM-hash version 3 64-bits
                             //   9: hashlittle 32-bits
                             //  10: wyhash 64-bits
                             //  11: FastHash32
                             //  12: FastHash64
                             //  13: t1ha0 (Linux only) [meson build backend only]
                             //  14: t1ha2 [meson build backend only]
...
Default is the wyhash 64-bits, which produced best results in tests in our domain of work.
So you may choose another one. Each has its pros and cons. If you change the constant,
don’t forget to t2build tranalyzer2.
Flow timeout and flow duration
The constant FLOW_TIMEOUT in tranalyzer.h defines the maximum amount of time after the last packet received
until a flow will be removed from memory and send to the appropriate output channel.
The standard flow timeout is set to 182 seconds, so more than 3 minutes, which is an
empirical value covering most of the keep alive packets. It can be changed according to
the users discretion. This value is overwritten by any plugin which takes configures
of the flow timeout engine in the core, such as tcpStates. So TCP flows encountering
a RST or FIN should timeout immediately instead of wasting memory.
If the value of FLOW_TIMEOUT is very small, more flows can be created and hence
more output, resulting in higher delays.
The FDURLIMIT value controls the maximum Flow duration until released from memory.
This option is independent of FLOW_TIMEOUT. A value > 0 activates the feature.
If it is chosen small, then large numbers of flows are created, resulting also in higher delays,
because more output is generated per time.
As FDURLIMIT is often used to minimize the time until a flow becomes visible in the output.
vi src/tranalyzer.h
...
// Maximum lifetime of a flow
#define FDURLIMIT  0 // if > 0; forced flow life span of n +- 1 seconds
#define FDLSFINDEX 0 // if (FDURLIMIT) 0: Different findex; 1: Same findex for flows of a superflow

// The standard timeout for a flow in seconds
#define FLOW_TIMEOUT 182 // flow timeout after a packet is not seen after n seconds
...
For a detailed explanation move to the Flow timeout control tutorial.
Verbose
In order to reduce the clutter being transferred to a socket or stdout T2 can be muted.
In tranalyzer.h the variable VERBOSE controls T2 reporting.
vi src/tranalyzer.h
...
/*
 * The verbose level of final report:
 * 0: no output
 * 1: Basic pcap report
 * 2: + full traffic statistics
 * 3: + info about frag anomalies
 */
#define VERBOSE 2
...
So set VERBOSE to 0 by using t2conf and recompile with the -R option,
as plugin also implement VERBOSE:
t2conf tranalyzer2 D VERBOSE=0 && t2build -R
Now no output is generated to stdout anymore.
Packets/flow distribution
In order to get an idea about performance problems, look at the end report
of T2 as already discussed above. Often a detailed view of the distribution
or the calculation of the center of mass of the distribution helps to assess
the situation. The script t2flowstat under tranalyzer2/scripts comes to the
rescue.
t2flowstat -h
Usage:
    t2flowstat [OPTION...] <FILE_flows.txt>

Optional arguments:
    -c col        Column name or number
    -d dir        Select one flow direction only (A or B)
    -m max        Maximum value to bin (requires -s option)
    -n            No bin statistics
    -s size       Bin size (requires -m option)
    -t            gnuplot mode
    -0            Suppress 0 counts

    -h, --help    Show this help, then exit
It computes the packet distribution in selected bins and produces global
parameters such as the median of a distribution. Let’s generate the numPktsSnt
statistics of A and B flows from ~/results/annoloc2_flows.txt we already generated in
earlier scenarios. If you erased it, just run T2 on
annoloc2.pcap again.
t2 -r data/annoloc2.pcap -w ~/results
t2flowstat ~/results/annoloc2_flows.txt -c numPktsSnt -s 1 -m 20
bin	count	relCnt
0-0	0	0
1-1	6673	37.9083
2-2	2402	13.6454
3-3	1403	7.97023
4-4	1136	6.45345
5-5	926	5.26047
6-6	472	2.68136
7-7	366	2.07919
8-8	379	2.15304
9-9	207	1.17594
10-10	139	0.789638
11-11	80	0.454468
12-12	113	0.641936
13-13	100	0.568085
14-14	77	0.437425
15-15	61	0.346532
16-16	66	0.374936
17-17	60	0.340851
18-18	59	0.33517
19-19	47	0.267
----------------------------------
#Flows : 17603
Col Sum: 1219015
Max Col: 23601
Median : 1.886137
Mean   : 69.250412
Std Dev: 54.912996
KP Skew: 1.226746
I chose only 20 samples because I already knew that the curve is Poisson like and binning 1 to generate a precise descriptive statistics. The mean is at 1.9 packets/flow with a high standard deviation and the non parametric skew tells us that the distribution is slanted to the left and spread out as the standard deviation indicates, which agrees nicely with the bin statistics.
Note that 50% of all packets processed by t2 produce a new flow with 1.8 packets, which indicates a serious performance issue on interface operations if excessive L7 plugins are loaded or the average bandwidth reaches 6 GBit/s.
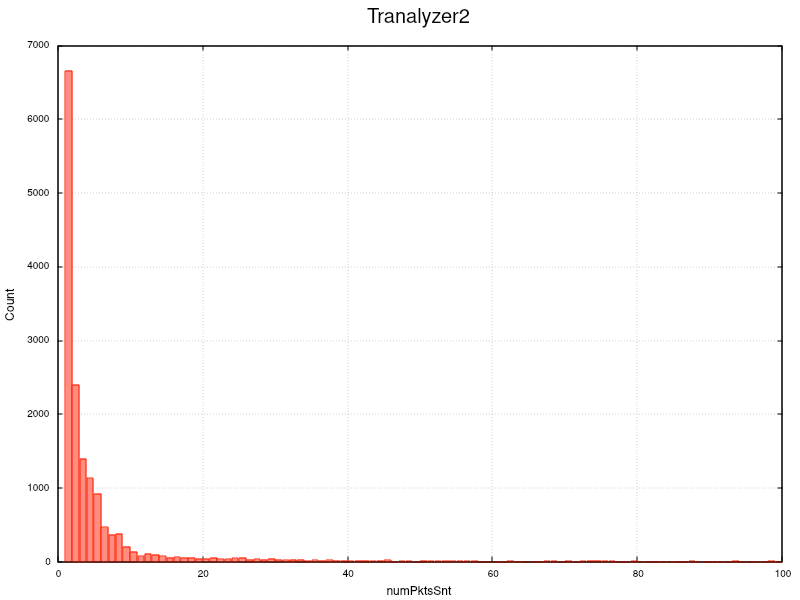
If you look at the first 100 packet/flow bins below, you clearly spot the rapid decay, which
is very typical of today’s traffic in the wild. You could now use the -t option of t2flowstat and pipe
the result into t2plot or use
t2plot on the column in the flow file directly.
t2plot ~/results/annoloc2_flows.txt -o numPktsSnt -H 1 -sx 0:100 -g
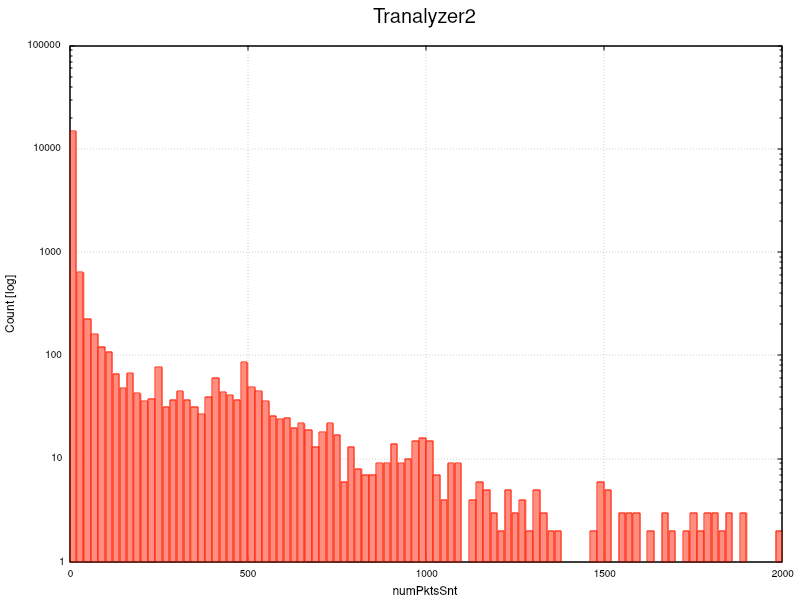
But if you plot up to 2000 in a logarithmic scale you see scattered flows in the long tail of the distribution.
t2plot ~/results/annoloc2_flows.txt -o numPktsSnt -H 20 -sx 0:2000 -ly
So what does it mean when 50% of the packets produce a new flow with 1.8 packets? This will increase the flow creation and termination load on any tool, not only T2. So if the bitrate exceeds the processing power of the core, e.g. > 5-6 GBit/s and several L7 plugins are loaded, you might start dropping packets.
So you need to increase the hash space and the number of hash buckets by
choosing the appropriate -f value in the command line. Just extract some
seconds of traffic, run t2 on it and see where the hash autopilot kicks in,
he will tell you the right -f value.
Hence it is essential to know the packet/flow distribution and its median of the traffic on your interface, so that you can eliminate unwanted flow production, e.g. by defining an additional BPF filter, or optimizing the dissectors, which we will discuss in the next chapter.
Dissector optimization
If you already know that certain encapsulation protocols such as L2TP, GRE, … are not in your traffic,
why having code for it present? Switch them off by configuring the dissector in the core. The switches are residing in
tranalyzer.h, search for Protocol stack:
vi src/tranalyzer.h
...
// Protocol stack
#define AYIYA           1 // AYIYA processing on: 1, off: 0
#define GENEVE          1 // GENEVE processing on: 1, off: 0
#define TEREDO          1 // TEREDO processing on: 1, off: 0
#define L2TP            1 // L2TP processing on: 1, off: 0
#define GRE             1 // GRE processing on: 1, off: 0
#define GTP             1 // GTP processing on: 1, off: 0
#define VXLAN           1 // VXLAN processing on: 1, off: 0
#define IPIP            1 // IPv4/6 in IPv4/6 processing on: 1, off: 0
#define ETHIP           1 // Ethernet over IP on: 1, off: 0
#define CAPWAP          1 // CAPWAP processing on: 1, off: 0
#define LWAPP           1 // LWAPP processing on: 1, off: 0
#define DTLS            1 // DTLS processing on: 1, off: 0
...
If you are sure that in your traffic is not L2TP, GRE, TEREDO or IPIP then switch them off, and save code run time.
t2conf tranalyzer2 -D TEREDO=0 -D L2TP=0 -D GRE=0 -D IPIP=0 && t2build tranalyzer2
BPF filtering
If you are only interested in certain traffic, e.g. UDP or HTTP then pre-filter it via BPF. Why generate flows for something you do not need, right? That is a splendid performance enhancer.
t2 -r ~/data/annoloc2.pcap -w ~/results/ 'udp and port 53'
The end report shows only UDP traffic, aka DNS traffic.
head -n 10 ~/results/annoloc2_flows.txt | tcol
Binary output
If you need to write to disk or a slow medium, then the only option is to reduce the volume by choosing binary coding. The worst you could choose is JSON. This format was probably invented by a sadist who likes to torture HW and programmers. So the binSink plugin is your best and non-sadistic choice for optimal performance.
The configuration in binSink.h gives you the choice to compress the binary even
more and whether you want to split binary files when the -W option is used.
You have to test whether the computing overhead is a lesser pain than the additional
bytes written to a slow medium or a channel with low bandwidth.
binSink
vi src/binSink
...
/* ========================================================================== */
/* ------------------------ USER CONFIGURATION FLAGS ------------------------ */
/* ========================================================================== */

#define BFS_GZ_COMPRESS             0 // Compress (gzip) the output
#define BFS_SFS_SPLIT               1 // Split output file (-W option)

/* +++++++++++++++++++++ ENV / RUNTIME - conf Variables +++++++++++++++++++++ */

#define BFS_FLOWS_SUFFIX "_flows.bin" // Suffix for output file

/* ========================================================================== */
/* ------------------------- DO NOT EDIT BELOW HERE ------------------------- */
/* ========================================================================== */
...
All constants can be configured by t2conf binSink -D ....
As an exercise add the binSink plugin and run t2 on annoloc2.pcap.
Then, decode the binary flow file with t2b2t
(automatically compiled with the binSink plugin). If you did not, then t2b2t will ask you if
it can compile itself.
You can do a diff between the txtSink file and the t2b2t file if you wish.
And if you really insist, you can even convert it to JSON crap.
Here are some sample commands for you to use.
t2build binSink
t2 -r ~/data/annoloc2.pcap -w ~/results 'udp and port 53'================================================================================ Tranalyzer 0.9.2 (Anteater), Cobra. PID: 29053, SID: 666 ================================================================================ [INF] Creating flows for L2, IPv4, IPv6 Active plugins: 01: basicFlow, 0.9.2 02: basicStats, 0.9.2 03: tcpStates, 0.9.2 04: binSink, 0.9.2 05: txtSink, 0.9.2 [INF] IPv4 Ver: 5, Rev: 09082023, Range Mode: 0, subnet ranges loaded: 481438 (481.44 K) [INF] IPv6 Ver: 5, Rev: 09082023, Range Mode: 0, subnet ranges loaded: 41486 (41.49 K) Processing file: /home/user/data/annoloc2.pcap [INF] BPF: udp and port 53 Link layer type: Ethernet [EN10MB/1] Snapshot length: 66 Dump start: 1022171701.692718000 sec (Thu 23 May 2002 16:35:01 GMT) [WRN] snapL2Length: 54 - snapL3Length: 40 - IP length in header: 65 Dump stop : 1022171726.636776000 sec (Thu 23 May 2002 16:35:26 GMT) Total dump duration: 24.944058000 sec Finished processing. Elapsed time: 0.125040674 sec Finished unloading flow memory. Time: 0.129497048 sec Percentage completed: 0.25% Number of processed packets: 2928 (2.93 K) Number of processed bytes: 158112 (158.11 K) Number of raw bytes: 276323 (276.32 K) Number of pad bytes: 37 Number of pcap bytes: 83586990 (83.59 M) Number of IPv4 packets: 2928 (2.93 K) [100.00%] Number of A packets: 1459 (1.46 K) [49.83%] Number of B packets: 1469 (1.47 K) [50.17%] Number of A bytes: 78786 (78.79 K) [49.83%] Number of B bytes: 79326 (79.33 K) [50.17%] <A packet load>: 54.00 <B packet load>: 54.00 -------------------------------------------------------------------------------- basicStats: Flow max(pktload): 509 basicStats: Flow max(b/s), pkts: 5361702 (5.36 Mb/s), 3 basicStats: Biggest L3 flow talker: 138.212.18.252 (JP): 464 [15.85%] packets basicStats: Biggest L3 flow talker: 138.212.18.252 (JP): 17317 (17.32 K) [10.95%] bytes -------------------------------------------------------------------------------- Headers count: min: 3, max: 3, average: 3.00 Number of UDP packets: 2928 (2.93 K) [100.00%] Number of UDP bytes: 158112 (158.11 K) [100.00%] ~~~~~~~~~~~~~~~~~~~~~~~~~~~~~~~~~~~~~~~~~~~~~~~~~~~~~~~~~~~~~~~~~~~~~~~~~~~~~~~~ Number of processed flows: 396 Number of processed IPv4 flows: 396 [100.00%] Number of processed A flows: 199 [50.25%] Number of processed B flows: 197 [49.75%] Number of request flows: 198 [50.00%] Number of reply flows: 198 [50.00%] Total A/B flow asymmetry: 0.01 Total req/rply flow asymmetry: 0.00 Number of processed packets/flows: 7.39 Number of processed A packets/flows: 7.33 Number of processed B packets/flows: 7.46 Number of processed total packets/s: 117.38 Number of processed A+B packets/s: 117.38 Number of processed A packets/s: 58.49 Number of processed B packets/s: 58.89 ~~~~~~~~~~~~~~~~~~~~~~~~~~~~~~~~~~~~~~~~~~~~~~~~~~~~~~~~~~~~~~~~~~~~~~~~~~~~~~~~ <Number of processed flows/s>: 15.88 <Bandwidth>: 88610 b/s (88.61 Kb/s) <Snapped bandwidth>: 50709 b/s (50.71 Kb/s) <Raw bandwidth>: 88622 b/s (88.62 Kb/s) Max number of flows in memory: 396 [0.15%] Memory usage: 0.02 GB [0.03%] Aggregated flowStat=0x0400100200004000 Per packet CPU time: min: 0.000000298, max: 0.000266102, ave: 0.000001198, std: 0.000007231 [WRN] L3 SnapLength < Length in IP header [WRN] Consecutive duplicate IP ID [INF] IPv4 flows
t2b2t -r ~/results/annoloc2_flows.bin -w -
And if you really insist, you can even convert it to JSON crap.
t2b2t -r ~/results/annoloc2_flows.bin -j -w ~/results/annoloc2_flows.json
[OK] Successfully converted '/home/wurst/results/annoloc2_flows.bin' to '/home/wurst/results/annoloc2_flows.json'
Look into ~/results/annoloc2_flows.json and you will see bloody JSON.
Plugins and configuration
The more plugins are loaded the slower t2 gets, as more SW does not produce more performance on a given HW. If a Softie tells you otherwise, he talks plain bullshit.
So think first what you want to see in your flows or summary files, then load the plugins. Each plugin can be tailored for a given task, so Code can be switched off, increasing performance.
E.g. If you do not need the windows size engine or the checksum calculation in tcpFlags, switch it off.
If you are not interested in a detailed IAT statistics, switch BS_IAT_STATS and
BS_STDDEV off in basicStats.
If you are interested in detecting botnets with dnsDecode, then switch DNS_MODE to 1,
as all the answer and aux records are not necessary. Switch DNS_REQA to 1 to avoid storing
the same request record multiple times.
Run T2 with protoStat on the interface and look which protocols are present and unload plugins which are not needed. Or take a sample pcap and run all plugins on it and unload plugins who do not produce output in the end report.
Sometimes you want to detect whether there is unencrypted traffic in your corporate network, then use pwX and protoStat alone. If pwX produces output, you are in trouble, so fix that first, before you load other plugins.
Parallelization
The last line is always parallelization, which is a bit different as in other tools, as you have control over the whole process. So continue here
Conclusion
Don’t forget to reset t2 for the next tutorials:
t2conf --reset -a && t2build -R
Have fun!