Basic analysis
Contents
- Who is the Anteater
- T2 operational modes
- How to Anteater
- Unpack and go
- Basic flow based plugins
- Layer 4 based plugins
- Basic traffic volume and connection analysis
- Spotting connection anomalies with connStat
- Timeline flow analysis
- Global statistical plugins
- Add layer 2/4 information
- Operational mode switching: ETH, IPv4/6, SCTP
- Flow hash autopilot: overload protection
Who is the Anteater
Tranalyzer2 (T2) was created at a Swiss operator out of the need that standard Cisco NetFlow did not supply the fields we needed for our troubleshooting and security work. We needed all kinds of encapsulated protocols, content info, advanced statistics and an easy way to extract information for traffic mining. And most important a tool which can digest really large pcaps and runs stable on an interface. Therefore, only code and functionality which is needed by the user is added. That should explain, why a lot of T2 is controlled by compiler switches, making it adaptable and lightweight. But no worries, we made compiling on different infrastructure easy for you.
Having also students with us, we saw that they always reinvented the wheel when it came to traffic analysis, so in 2008 T2 became open source. Since then practical ideas from people working in the field and in research inspired the path of the Anteater.
This tutorial will teach you about the basic configuration, usage, basic plugins and post-processing philosophy. So, let’s first look at the basic protocol and output modes.
T2 operational modes
By default T2 operates in the following basic protocol modes:
- Layer 2
- IPv4
- IPv6
- SCTP
By default since the 0.8.0 version T2 operates concurrently in all protocol modes and feeds output into the same files. If you are only interested in IPv4 without decapsulation of protocols such as L2TP, GRE, IPv[46]-in-IPv[46], etc, T2 can be easily configured to do just this. Moreover L4 protocols support is supplied, e.g., SCTP which transforms all streams into extra flows, if enabled in networkHeaders.h. We will discuss these operational modes at the end of the tutorial.
T2 is capable to produce the following concurrent jobs.
Let’s have a quick look at these different modi operandi.
Flow
The most prominent one is flow, where traffic is aggregated into so called flows including all kind of nifty statistics.
A flow is defined as A and opposite B Flow which are linked by a unique flowIndex, a 64 bit number. The default aggregation of T2 flows is
(vlanID, srcIP, srcPort, dstIP, dstPort, l4Proto)which covers most cases in corporate networks, as VLANs are very common. It can be extended to
(srcMac, dstMac, ethType, vlanID, srcIP, srcPort, dstIP, dstPort, sctpChannel, l4Proto)or reduced to aggregate all traffic into a few flows, defining only several networks without VLANs, ports and protocols. The advanced flow aggregation modes are discussed in the Flexible Flow Aggregation tutorial.
Each plugin added to T2 will produce additional columns in the flow file, producing an output easy to process for any script ibased language or standard tools, such as Excel or SPSS.
The output is controlled by so called sink plugins. Default is the txtSink plugin, which produces a human readable, mining and script friendly column based output. You will see a lot of it in this tutorial. Others are
- binSink: binary compressed, processor friendly output, can be converted to text using
t2b2t - jsonSink: JSON output, the least efficient form of output
- socketSink: export via a UDP/TCP socket
- netflowSink: export in Cisco NetFlow v9/10 format
T2 can also log into databases using the following sinks:
- mongoSink: MongoDB
- sqliteSink: SQLite
- mysqlSink: MariaDB / MySQL
- psqlSink: PostgreSQL
- clickhouseSink: ClickHouse
- kafkaSink: Apache Kafka event streaming platform
The flow mode also provides several flow timing options which will be discussed in the Flow Mode tutorial.
Packet
The packet mode’s output format is as scripting friendly as the flow output and intended to be used as a drill down instrument,
which links back to flows and L7 content via the flowIndex.
This mode is discussed in detail in the Packet Mode tutorial.
Monitoring
Network managers often need certain time sampled parameters, such as number of packets or bandwidth. Hence, T2 reports into standard monitoring tools, such as RRD. This mode is discussed in detail in the Monitoring Mode tutorial.
Alarm
Sometimes L3-4 or content driven rules or even a custom build AI classifier defines what is interesting for the user. Hence, the alarm mode enables each plugin to control flow processing and release to output. This mode is discussed in detail in the Alarm Mode tutorial.
Force
When operating on an interface, the timeout of a flow is sometimes too long for an appropriate reaction, e.g., when malware is detected. So notification when a certain packet is seen is required. The force mode enables any plugin to control flow termination at any point in time. All following packets after flow release will be send to a new flow. This mode is discussed in detail in the Force Mode tutorial.
How to Anteater
In this chapter we will give you a practical introduction to the basic operations of the Anteater. The configuration is really easy thanks to numerous scripts, such as t2conf. So, if you are afraid of command line operations and header file (.h) editing, don’t worry!
If you are a Windows 10 user, please follow the Installing Tranalyzer on Windows tutorial first.
Unpack and go
To get started, download Tranalyzer and unpack the tar ball:
(BTW: lmw means Linux, Mac and Windows 10 tested)
tar -xf tranalyzer2-0.9.4lmw1.tar.gz
cd ~/tranalyzer2-0.9.4
lsautogen.sh ChangeLog doc plugins README.md scripts setup.sh tests tranalyzer2 utils
You see the doc folder, the README.md file (compilation, dependencies for different OS) and the setup.sh script (among others).
Tranalyzer2, aka the core, is located in the tranalyzer2 folder, while all the plugins can be found in the plugins folder.
arpDecode        clickhouseSink    ftpDecode    kafkaSink    nDPI           popDecode       sctpDecode  syslogDecode  voipDetector
autogen.sh       connStat          geoip        ldapDecode   netflowSink    portClassifier  smbDecode   t2PSkel       vrrpDecode
basicFlow        covertChannels    gquicDecode  liveXtr      nFrstPkts      protoStats      smtpDecode  tcpFlags      vtpDecode
basicStats       descriptiveStats  gsmDecode    lldpDecode   ntlmsspDecode  psqlSink        snmpDecode  tcpStates     wavelet
bayesClassifier  dfft              gtpDecode    macRecorder  ntpDecode      pwX             socketSink  telegram      wechatDecode
bgpDecode        dhcpDecode        httpSniffer  mndpDecode   ospfDecode     quicDecode      sqliteSink  telnetDecode
binSink          dnsDecode         icmpDecode   modbus       p0f            radiusDecode    sshDecode   tftpDecode
bitForensic      entropy           igmpDecode   mongoSink    payloadDumper  regexHyperscan  sslDecode   torDetector
cdpDecode        findexer          ircDecode    mqttDecode   pcapd          regex_pcre      stpDecode   tp0f
centrality       fnameLabel        jsonSink     mysqlSink    pktSIATHisto   regex_re2       stunDecode  txtSink
If you are a rookie to T2, use the setup.sh script under the tranalyzer root directory, it will install all tools, links and environment variables for you and compiles T2 with the standard basic plugins:
./setup.sh
If the setup finished successfully you are all set including the t2_aliases.
If you us the -a option all plugins will be installed including all necessary libraries.
The good and old fashion way without ./setup.sh is to invoke ./autogen.sh (note however that this method will NOT install t2_aliases)
./autogen.sh
If you want to use the t2_aliases (t2build, t2conf, …) in your current bash window, you have to run the following command:
source scripts/t2_aliases
Nevertheless, t2build uses now meson for compilation instead of autotools, as it is much faster.
If meson cannot be found on your system it will fall back to the latter. If you want to force
a certain build method refer to the Tranalyzer2 cheatsheet.
If a new bash window is opened all environmental variables will be automatically set.
Now try to use the auto-completion: t2 tab tab
t2          t2build     t2conf      t2doc       t2dpdk      t2fm        t2locate    t2netID     t2plugin    t2py        t2stat      t2timeline  t2update    t2voipconv
t2b2t       t2caplist   t2dmon      t2docker    t2flowstat  t2fuzz      t2mmdb      t2plot      t2PSkel/    t2rrd       t2test      t2topcap    t2viz       t2whois
t2 always points to the newest tranalyzer executable compiled under ~/tranalyzer2-0.x.y/tranalyzer2/build,
so you do not need to move to this directory and type ./tranalyzer.
t2build compiles the core and/or the plugins.
t2conf helps you configure the core and the plugins and t2stat helps you to send signals to the Anteater.
These are the most important command for you for the time being. We will come back to the t2 commands later.
Here is a list of the most important t2build options which we will use in this tutorial.
(If you want to know more look at the Building tutorial
or invoke t2build -h).
t2build -h |
show help |
t2build |
compile T2 and standard plugins |
t2build -u plugin |
unload plugin |
t2build -a |
compile T2 and all plugins |
t2build -c |
clean plugin directory |
t2build -d |
compile plugin in debug mode, for developers |
t2build -l |
list all plugins under plugin directory |
t2build -U |
update (download new blacklists, …) |
t2build -f |
force rebuild of makefiles |
t2build -e |
empty the plugin folder and exit |
t2build -r |
recompile plugin from scratch |
t2build -R |
recompile all plugins under plugin directory |
Note that if you have an older version of autotools or meson, t2build might complain with the following message:
### ERROR: Build directory has been generated with Meson version 0.x.y, which is incompatible with the current version 0.z.v.`Don’t worry, just recompile with t2build -r to rejuvenate the compiler configure files.
If you want to change any configuration of plugins or the core, execute
t2conf plugin -D CONSTANT=value
We will practice that extensively in the following. If you want to know more, have a look at the Configuration tutorial.
There is also a list of acronyms available to facilitate navigation:
tran |
goto latest version of t2 |
.tran |
goto the plugin directory |
tranpl |
goto plugin directory of latest version |
plugin |
goto root directory of plugin |
utils |
goto utils directory |
subnetutils |
goto subnet directory |
t2doc plugin |
show doc of plugin |
Let’s check it out!
$ tran [tranalyzer2-0.9.4]$ lsautogen.sh ChangeLog doc plugins README.md scripts setup.sh tests tranalyzer2 utils.tran [plugins]$ ls
001_protoStats.so  110_macRecorder.so     120_basicStats.so  132_tcpStates.so   150_tcpWin.so       500_connStat.so  ethertypes.txt  portmap.txt  subnets4_HLP.bin
100_basicFlow.so   111_portClassifier.so  130_tcpFlags.so    140_icmpDecode.so  310_httpSniffer.so  901_txtSink.so   manuf.txt       proto.txt    subnets6_HLP.bin
tranpl
ls
arpDecode   binSink           dhcpDecode  fnameLabel   icmpDecode  lldpDecode   mysqlSink    ntpDecode   pktSIATHisto    psqlSink      sctpDecode  socketSink  stpDecode     tcpFlags      tftpDecode    vrrpDecode
autogen.sh  cdpDecode         dnsDecode   ftpDecode    igmpDecode  macRecorder  nDPI         ospfDecode  popDecode       pwX           smbDecode   sqliteSink  stunDecode    tcpStates     tp0f          wavelet
basicFlow   connStat          entropy     geoip        ircDecode   modbus       netflowSink  p0f         portClassifier  radiusDecode  smtpDecode  sshDecode   syslogDecode  tcpWin        txtSink
basicStats  descriptiveStats  findexer    httpSniffer  jsonSink    mongoSink    nFrstPkts    pcapd       protoStats      regex_pcre    snmpDecode  sslDecode   t2PSkel       telnetDecode  voipDetector
basicStats
ls
AUTHORS autogen.sh ChangeLog configure.ac COPYING doc Makefile.am NEWS README src t2plconf tests
t2doc tcpFlags
Documentation for plugin 'tcpFlags' does not exist... build it (Y/n)? y
...

... Popup of a PDF! ...
subnetutils
ls
corr6.c   faasn6.c     mrgasn6.c  muipr6.c   priv6.txt  subconv           subnets4.txt      subnets6_HL.txt   ttor             whoOrgCds.txt
ext4.c    Makefile     mrgipl4.c  nett4.c    rng6.c     subnets4_HLP.bin  subnets4.txt.bz2  subnets6.txt      vect4.c          whoOrgCds.txt.bz2
ext6.c    Makefile_AI  mrgipl6.c  nett6.c    sbm4.c     subnets4_HLP.txt  subnets6_HLP.bin  subnets6.txt.bz2  vect6.c
faasn4.c  mrgasn4.c    muipr4.c   priv4.txt  sbm6.c     subnets4_HL.txt   subnets6_HLP.txt  t2netID           whoCntryCds.txt
See? All very simple. It is very helpful to read the documentation, which will be built by invoking t2doc.
These acronyms proved really helpful when developing and debugging new plugins.
If the compilation is successful the utils/subnet directory contains all steps of the subnet file building process: *_HL.txt, _HLP.txt, _HLP.bin. Only the last is relevant for T2, the first two exist for debug purposes. If the compilation fails, T2 will tell you what is missing, then refer to the README.md* under the ~/tranalyzer2-0.9.4 folder or copy the appropriate dependencies from here. If nothing works, look in the FAQ. If that does not solve your problem, write to the Anteater. He will definitely help you.
If setup is successful then you may start t2 for a quick test:
t2
Tranalyzer 0.9.4 - High performance flow based network traffic analyzer

Usage:
    tranalyzer [OPTION...] <INPUT>

Input arguments:
    -i IFACE     Listen on interface IFACE
    -r PCAP      Read packets from PCAP file or from stdin if PCAP is "-"
    -R FILE      Process every PCAP file listed in FILE
    -D EXPR[:SCHR][,STOP]
                 Process every PCAP file whose name matches EXPR, up to an
                 optional last index STOP. If STOP is omitted, then Tranalyzer
                 never stops. EXPR can be a filename, e.g., file.pcap0, or an
                 expression, such as "dump*.pcap00", where the star matches
                 anything (note the quotes to prevent the shell from
                 interpreting the expression). SCHR can be used to specify
                 the last character before the index (default: 'p')

Output arguments:
    -w PREFIX    Append PREFIX to any output file produced. If the option is
                 omitted, derive PREFIX from the input. Use '-w -' to output
                 the flow file to stdout (other files will be saved as if the
                 '-w' option had been omitted and the '-l' and '-m' options used)
    -W PREFIX[:SIZE][,START]
                 Like -w, but fragment flow files according to SIZE, producing
                 files starting with index START. SIZE can be specified in bytes
                 (default), KB ('K'), MB ('M') or GB ('G'). Scientific notation,
                 i.e., 1e5 or 1E5 (=100000), can be used as well. If a 'f' is
                 appended, e.g., 10Kf, then SIZE denotes the number of flows.
    -l           Print end report in PREFIX_log.txt instead of stdout
    -m           Print monitoring output in PREFIX_monitoring.txt instead of stdout
    -s           Packet forensics mode

Interface capture arguments:
    -S SNAPLEN   Set the snapshot length (used with -i option)
    -B BUFSIZE   Set the live Rx buffer size (used with -i option)

Optional arguments:
    -p PATH      Load plugins from PATH instead of ~/.tranalyzer/plugins
    -b FILE      Use plugin list FILE instead of plugin_folder/plugins.txt
    -e FILE      Create a PCAP file by extracting all packets belonging to
                 flow indexes listed in FILE (require pcapd plugin)
    -f FACTOR    Set hash multiplication factor
    -x ID        Sensor ID
    -c CPU       Bind tranalyzer to one core. If CPU is 0 then OS selects the
                 core to bind
    -P PRIO      Set tranalyzer priority to PRIO (int) instead of 0
                 (PRIO [highest, lowest]: [-20, 20] (root), [0, 20] (user))
    -M FLT       Set monitoring interval to FLT seconds
    -F FILE      Read BPF filter from FILE

Help and documentation arguments:
    -V           Show the version of the program and exit
    -h           Show help options and exit

Remaining arguments:
    BPF          Berkeley Packet Filter command, as in tcpdump
If you cannot wait and would like to try it now on an interface, go ahead and use the -i option,
but first, make sure to read the Performance and Interface et al tutorial!
As you need to increase the input buffer with the -B option first.
For reproducibility we will read from pcaps, so only the -r, -R or -D options are relevant for now.
The latter two are only useful if more than one pcap is to be analyzed
(learn more about that in the Multi File I/O tutorial!).
For this tutorial, -r is the option of choice.
The -w option defines where the flow files will be written to. If you omit it, T2 writes to the folder of the pcap and derives the output prefix from the pcap.
All the other options about setting snaplen, bufsize, priority or cpu binding are not relevant
for now. They are explained later.
A good practice for analysis and mining jobs is to create a separate data and results directory as follows:
mkdir ~/data ~/results
cd ~/data
Download the pcap annoloc2.pcap into your data folder either with a click on the link or via command line.
cd ~/data
wget https://tranalyzer.com/download/data/annoloc2.pcap
Now feed the pcap to the Anteater as follows:
t2 -r ~/data/annoloc2.pcap -w ~/results================================================================================ Tranalyzer 0.9.4 (Anteater), Cobra. PID: 19777, Prio: 0, SID: 666 ================================================================================ Date: 1750851373.000199888 sec (Wed 25 Jun 2025 13:36:13 CEST) [INF] Creating flows for L2, IPv4, IPv6 Active plugins: 01: protoStats, 0.9.4 02: basicFlow, 0.9.4 03: macRecorder, 0.9.4 04: portClassifier, 0.9.4 05: basicStats, 0.9.4 06: tcpFlags, 0.9.4 07: tcpStates, 0.9.4 08: icmpDecode, 0.9.4 09: connStat, 0.9.4 10: txtSink, 0.9.4 [INF] IPv4 Ver: 6, Rev: 21062025, Range Mode: 0, subnet ranges loaded: 7252123 (7.25 M) [INF] IPv6 Ver: 6, Rev: 21062025, Range Mode: 0, subnet ranges loaded: 1419259 (1.42 M) [INF] macRecorder: 84111 (84.11 K) short org name records loaded Processing file: /home/user/data/annoloc2.pcap Link layer type: Ethernet [EN10MB/1] Snapshot length: 66 Dump start: 1022171701.691172000 sec (Thu 23 May 2002 16:35:01 GMT) [WRN] snapL2Length: 54 - snapL3Length: 40 - IP length in header: 1500 Dump stop : 1022171726.640398000 sec (Thu 23 May 2002 16:35:26 GMT) Total dump duration: 24.949226000 sec Finished processing. Elapsed time: 1.310285013 sec Finished unloading flow memory. Time: 1.798155327 sec Percentage completed: 100.00% Number of processed packets: 1219015 (1.22 M) Number of processed bytes: 64082726 (64.08 M) Number of raw bytes: 844642686 (844.64 M) Number of pad bytes: 1758405 (1.76 M) Number of pcap bytes: 83586990 (83.59 M) Number of L2 packets: 247 [0.02%] Number of IPv4 packets: 1218588 (1.22 M) [99.96%] Number of IPv6 packets: 180 [0.01%] Number of A packets: 561592 (561.59 K) [46.07%] Number of B packets: 657423 (657.42 K) [53.93%] Number of A bytes: 29274120 (29.27 M) [45.68%] Number of B bytes: 34808606 (34.81 M) [54.32%] <A packet load>: 52.13 <B packet load>: 52.95 -------------------------------------------------------------------------------- macRecorder: MAC pairs per flow: min: 1, max: 2, average: 1.00 basicStats: Flow max(pktload): 1480 (1.48 K) basicStats: Flow max(b/s), pkts: 19015999488 (19.02 Gb/s), 2 basicStats: Biggest L2 flow talker: 00:d0:02:6d:78:00: 57 [0.00%] packets basicStats: Biggest L2 flow talker: 00:d0:02:6d:78:00: 2622 (2.62 K) [0.00%] bytes basicStats: Biggest L3 flow talker: 138.212.189.38 (JP): 23601 (23.60 K) [1.94%] packets basicStats: Biggest L3 flow talker: 138.212.189.38 (JP): 33731054 (33.73 M) [52.64%] bytes tcpFlags: Aggregated ipFlags=0x7964 tcpFlags: Aggregated tcpFStat=0x5fff tcpFlags: Aggregated tcpFlags=0x07ff tcpFlags: Aggregated tcpAnomaly=0x23ff tcpFlags: Aggregated ipToS=0xff tcpFlags: Number of TCP scans attempted, successful: 970, 875 [90.21%] tcpFlags: Number of TCP SYN retries, seq retries: 147, 5286 (5.29 K) tcpFlags: Number WinSz below 1: 1280 (1.28 K) [0.13%] tcpStates: Aggregated tcpStatesAFlags=0xdf icmpDecode: Aggregated icmpStat=0x21 icmpDecode: Number of ICMP echo request packets: 224 [7.32%] icmpDecode: Number of ICMP echo reply packets: 191 [6.24%] icmpDecode: ICMP echo reply / request ratio: 0.85 connStat: Number of unique source IPs: 3861 (3.86 K) connStat: Number of unique destination IPs: 2920 (2.92 K) connStat: Number of unique source/destination IPs connections: 182 connStat: Max unique number of source IP / destination port connections: 413 connStat: IP connF=connSipDprt/connSip: 0.106967 connStat: IP connG=connSipDprt/connSipDip: 2.269231 connStat: Source IP with max connections: 138.212.189.66 (JP): 369 connections connStat: Destination IP with max connections: 138.212.184.235 (JP): 403 connections connStat: Biggest L3 talker: 138.212.189.38 (JP): 33706 (33.71 K) [2.77%] packets connStat: Biggest L3 talker: 138.212.189.38 (JP): 48279870 (48.28 M) [75.34%] bytes -------------------------------------------------------------------------------- Headers count: min: 2, max: 5, avg: 3.01 Number of ARP packets: 247 [0.02%] Number of GRE packets: 20 [0.00%] Number of IGMP packets: 12 [0.00%] Number of ICMP packets: 3059 (3.06 K) [0.25%] Number of ICMPv6 packets: 11 [0.00%] Number of TCP packets: 948743 (948.74 K) [77.83%] Number of TCP bytes: 52643546 (52.64 M) [82.15%] Number of UDP packets: 266900 (266.90 K) [21.89%] Number of UDP bytes: 11234272 (11.23 M) [17.53%] Number of IPv4 fragmented packets: 2284 (2.28 K) [0.19%] ~~~~~~~~~~~~~~~~~~~~~~~~~~~~~~~~~~~~~~~~~~~~~~~~~~~~~~~~~~~~~~~~~~~~~~~~~~~~~~~~ Number of processed flows: 17601 (17.60 K) Number of processed L2 flows: 99 [0.56%] Number of processed IPv4 flows: 17440 (17.44 K) [99.09%] Number of processed IPv6 flows: 62 [0.35%] Number of processed A flows: 9994 (9.99 K) [56.78%] Number of processed B flows: 7607 (7.61 K) [43.22%] Number of request flows: 9466 (9.47 K) [53.78%] Number of reply flows: 8135 (8.13 K) [46.22%] Total A/B flow asymmetry: 0.14 Total req/rply flow asymmetry: 0.08 Number of processed A+B packets/A+B flows: 69.26 Number of processed A packets/A flows: 56.19 Number of processed B packets/ B flows: 86.42 Number of processed total packets/s: 48859.83 (48.86 K) Number of processed A+B packets/s: 48859.83 (48.86 K) Number of processed A packets/s: 22509.40 (22.51 K) Number of processed B packets/s: 26350.44 (26.35 K) ~~~~~~~~~~~~~~~~~~~~~~~~~~~~~~~~~~~~~~~~~~~~~~~~~~~~~~~~~~~~~~~~~~~~~~~~~~~~~~~~ <Number of processed flows/s>: 705.47 <Bandwidth>: 270268555 b/s (270.27 Mb/s) <Snapped bandwidth>: 20548205 b/s (20.55 Mb/s) <Raw bandwidth>: 270835716 b/s (270.84 Mb/s) Max number of flows in memory: 15218 (15.22 K) [5.81%] Memory usage: 0.18 GB [2.19%] Aggregated flowStat=0x0c0018fa0222d044 [WRN] L3 SnapLength < Length in IP header [WRN] L4 header snapped [WRN] Consecutive duplicate IP ID [WRN] IPv4/6 fragmentation header packet missing [WRN] IPv4/6 packet fragmentation sequence not finished [INF] Stop dissecting: Clipped packet, unhandled protocol or subsequent fragment [INF] Layer 2 flows [INF] IPv4 flows [INF] IPv6 flows [INF] ARP [INF] IPv4/6 fragmentation [INF] IPv4/6 in IPv4/6 [INF] GRE encapsulation [INF] GTP tunnel [INF] SSDP/UPnP
T2 produces an end report, which serves as an initial assessment of the pcap content and anomalies. It is divided into the following categories:
[INF] Creating flows for L2, LAPD, IPv4, IPv6, SCTP [ALARM] [FORCE]
Plugin Load info
Information, warnings and errors
Pcap info and Statistics
--------------------------------------------------------------------------------
Plugin aggregated Statistics & Info
--------------------------------------------------------------------------------
Protocol aggregated L3/4 Statistics & Info
~~~~~~~~~~~~~~~~~~~~~~~~~~~~~~~~~~~~~~~~~~~~~~~~~~~~~~~~~~~~~~~~~~~~~~~~~~~~~~~~
Flow Statistics & Info
~~~~~~~~~~~~~~~~~~~~~~~~~~~~~~~~~~~~~~~~~~~~~~~~~~~~~~~~~~~~~~~~~~~~~~~~~~~~~~~~
Bandwidth Info
Memory usage

Aggregated Flow status
[INF]|[WRN]|[ERR] Aggregated flow information, warnings and errors
After basic packet and byte statistics, each plugin adds some statistical or hex coded info between the ------ lines
which will be discussed later. Moreover, flow based statistics are reported to assess the traffic seen
on the wire. At the end, certain protocol based information and warnings about traffic content are reported to alert the user.
Thus, an initial assessment is possible without even looking into flows or packets which is essential
when dealing with large quantities of traffic.
(Note that the [INF] blue color can be changed if it is poorly readable on your screen, just change the default color scheme in your terminal.)
The biggest talker comes from Japan, interesting, is this traffic from Asia? We will see…
To assess the nature of the traffic look at the aggregated flowStat first:
The flowStat column with value 0x0c0098fa0222d044 is to be interpreted as follows:

   bit | flowStat              | Description
   =============================================================================
     2 | 0x0000 0000 0000 0004 | Pure L2 flow
     6 | 0x0000 0000 0000 0040 | ARP
    12 | 0x0000 0000 0000 1000 | GRE v1/2
    14 | 0x0000 0000 0000 4000 | IPv4 flow
    15 | 0x0000 0000 0000 8000 | IPv6 flow
    17 | 0x0000 0000 0002 0000 | IPv4/6 in IPv4/6
    21 | 0x0000 0000 0020 0000 | GPRS Tunneling Protocol (GTP)
    25 | 0x0000 0000 0200 0000 | SSDP/UPnP
    33 | 0x0000 0002 0000 0000 | Acquired packet length < packet length in L3 header
    35 | 0x0000 0008 0000 0000 | Acquired packet length < minimal L4 header
    36 | 0x0000 0010 0000 0000 | IPv4 fragmentation present
    37 | 0x0000 0020 0000 0000 | IPv4 fragmentation error (refer to the tcpFlags plugin for more details)
    38 | 0x0000 0040 0000 0000 | IPv4 1. fragment out of sequence or missing
    39 | 0x0000 0080 0000 0000 | Packet fragmentation pending or fragmentation sequence not completed when flow timed-out
    43 | 0x0000 0800 0000 0000 | Stop dissecting: error, unhandled protocol or subsequent fragment
    44 | 0x0000 1000 0000 0000 | Consecutive duplicate IP ID
    47 | 0x0000 8000 0000 0000 | IPv4/6 payload length > framing length
    58 | 0x0400 0000 0000 0000 | IPv4 packet
    59 | 0x0800 0000 0000 0000 | IPv6 packet
So GRE and GPRS tunnels, SSDP, IPv6 in IPv4 or vice versa, this is not traffic from home and it is not the original traffic, at least not the full capture.
If you look at the snap length warning:
[WRN] snapL2Length: 54 - snapL3Length: 40 - IP length in header: 1500
and the infos in flowStat about the packet length, then you might think, besides not capturing the
payload somebody really messed with that traffic. And you are right! So if you are interested in payload,
without looking at the flows send it back to the idiot who produced that traffic. He just wastes your time.
All plugins reside in the plugins folder and own a src (.h, .c), a doc (.tex, .pdf) and a test (auto-testing) directory. Important for now is the doc folder, where you will find a PDF describing the plugin. The complete documentation of Tranalyzer2, all the plugins and scripts can be found under doc/documentation.pdf. The rest will be discussed later.
The primary goal of this tutorial is to give you a basic introduction to the art of traffic mining using Tranalyzer. So without further ado, let’s start with the very basics!
Basic flow based plugins
Beginners preferably use flow based text output, aka the extended NetFlow 7 flow output. We will only need the following:
| tranalyzer2 | Anteater’s core |
| basicFlow | Flow output definition + geo labeling + encapsulation info |
| basicStats | Basic statistics including Traffic Mining extensions |
| txtSink | Produces a tab separated text file: _flows.txt |
Let’s unload unnecessary compiled plugins first:
t2build -u protoStats macRecorder portClassifier tcpFlags tcpStates icmpDecode connStatPlugin 'protoStats' Plugin 'macRecorder' Plugin 'portClassifier' Plugin 'tcpFlags' Plugin 'tcpStates' Plugin 'icmpDecode' Plugin 'connStat' UNLOADING SUCCESSFUL
Now restart the Anteater and have a look at what changed in the end report:
t2 -r ~/data/annoloc2.pcap -w ~/results================================================================================ Tranalyzer 0.9.4 (Anteater), Cobra. PID: 7656, Prio: 0, SID: 666 ================================================================================ Date: 1751700153.000698562 sec (Sat 05 Jul 2025 09:22:33 CEST) [INF] Creating flows for L2, IPv4, IPv6 Active plugins: 01: basicFlow, 0.9.4 02: basicStats, 0.9.4 03: txtSink, 0.9.4 [INF] IPv4 Ver: 6, Rev: 02072025, Range Mode: 0, subnet ranges loaded: 7237787 (7.24 M) [INF] IPv6 Ver: 6, Rev: 02072025, Range Mode: 0, subnet ranges loaded: 1419259 (1.42 M) Processing file: /home/user/data/annoloc2.pcap Link layer type: Ethernet [EN10MB/1] Snapshot length: 66 Dump start: 1022171701.691172000 sec (Thu 23 May 2002 16:35:01 GMT) [WRN] snapL2Length: 54 - snapL3Length: 40 - IP length in header: 1500 Dump stop : 1022171726.640398000 sec (Thu 23 May 2002 16:35:26 GMT) Total dump duration: 24.949226000 sec Finished processing. Elapsed time: 0.253137633 sec Finished unloading flow memory. Time: 0.344000292 sec Percentage completed: 100.00% Number of processed packets: 1219015 (1.22 M) Number of processed bytes: 64082726 (64.08 M) Number of raw bytes: 844642686 (844.64 M) Number of pad bytes: 1758405 (1.76 M) Number of pcap bytes: 83586990 (83.59 M) Number of L2 packets: 247 [0.02%] Number of IPv4 packets: 1218588 (1.22 M) [99.96%] Number of IPv6 packets: 180 [0.01%] Number of A packets: 564228 (564.23 K) [46.29%] Number of B packets: 654787 (654.79 K) [53.71%] Number of A bytes: 29447896 (29.45 M) [45.95%] Number of B bytes: 34634830 (34.63 M) [54.05%] <A packet load>: 52.19 <B packet load>: 52.89 -------------------------------------------------------------------------------- basicStats: Flow max(pktload): 1480 (1.48 K) basicStats: Flow max(b/s), pkts: 19015999488 (19.02 Gb/s), 2 basicStats: Biggest L2 flow talker: 00:d0:02:6d:78:00: 57 [0.00%] packets basicStats: Biggest L2 flow talker: 00:d0:02:6d:78:00: 2622 (2.62 K) [0.00%] bytes basicStats: Biggest L3 flow talker: 138.212.189.38 (JP): 23601 (23.60 K) [1.94%] packets basicStats: Biggest L3 flow talker: 138.212.189.38 (JP): 33731054 (33.73 M) [52.64%] bytes -------------------------------------------------------------------------------- Headers count: min: 2, max: 5, avg: 3.01 Number of ARP packets: 247 [0.02%] Number of GRE packets: 20 [0.00%] Number of IGMP packets: 12 [0.00%] Number of ICMP packets: 3059 (3.06 K) [0.25%] Number of ICMPv6 packets: 11 [0.00%] Number of TCP packets: 948743 (948.74 K) [77.83%] Number of TCP bytes: 52643546 (52.64 M) [82.15%] Number of UDP packets: 266900 (266.90 K) [21.89%] Number of UDP bytes: 11234272 (11.23 M) [17.53%] Number of IPv4 fragmented packets: 2284 (2.28 K) [0.19%] ~~~~~~~~~~~~~~~~~~~~~~~~~~~~~~~~~~~~~~~~~~~~~~~~~~~~~~~~~~~~~~~~~~~~~~~~~~~~~~~~ Number of processed flows: 17098 (17.10 K) Number of processed L2 flows: 99 [0.58%] Number of processed IPv4 flows: 16937 (16.94 K) [99.06%] Number of processed IPv6 flows: 62 [0.36%] Number of processed A flows: 9718 (9.72 K) [56.84%] Number of processed B flows: 7380 (7.38 K) [43.16%] Number of request flows: 9675 (9.68 K) [56.59%] Number of reply flows: 7423 (7.42 K) [43.41%] Total A/B flow asymmetry: 0.14 Total req/rply flow asymmetry: 0.13 Number of processed A+B packets/A+B flows: 71.30 Number of processed A packets/A flows: 58.06 Number of processed B packets/ B flows: 88.72 Number of processed total packets/s: 48859.83 (48.86 K) Number of processed A+B packets/s: 48859.83 (48.86 K) Number of processed A packets/s: 22615.05 (22.61 K) Number of processed B packets/s: 26244.78 (26.24 K) ~~~~~~~~~~~~~~~~~~~~~~~~~~~~~~~~~~~~~~~~~~~~~~~~~~~~~~~~~~~~~~~~~~~~~~~~~~~~~~~~ <Number of processed flows/s>: 685.31 <Bandwidth>: 270268555 b/s (270.27 Mb/s) <Snapped bandwidth>: 20548205 b/s (20.55 Mb/s) <Raw bandwidth>: 270835716 b/s (270.84 Mb/s) Max number of flows in memory: 17098 (17.10 K) [6.52%] Memory usage: 0.11 GB [0.17%] Aggregated flowStat=0x0c0018fa0222d044 [WRN] L3 SnapLength < Length in IP header [WRN] L4 header snapped [WRN] Consecutive duplicate IP ID [WRN] IPv4/6 fragmentation header packet missing [WRN] IPv4/6 packet fragmentation sequence not finished [INF] Stop dissecting: Clipped packet, unhandled protocol or subsequent fragment [INF] Layer 2 flows [INF] IPv4 flows [INF] IPv6 flows [INF] ARP [INF] IPv4/6 fragmentation [INF] IPv4/6 in IPv4/6 [INF] GRE encapsulation [INF] GTP tunnel [INF] SSDP/UPnP
T2 produces an end report, which serves as an initial assessment of the pcap content and anomalies. Each plugin adds some info between the dashed lines. basicStats shows the biggest talker regarding traffic volume and country of origin. It is one of the first features relevant to understand large traffic pcaps. Biggest talkers combined with number of connections characterizes the host and the type of application. This will be discussed in Basic traffic volume and connection analysis.
It is an old pcap from 2002 recorded in the afternoon. It contains IPv4/6 and Ethernet traffic and the payload is snapped. At the bottom, you see warnings ([WRN]) and information ([INF]). You may also see errors ([ERR]). It is decoded from the aggregated flow status, which denotes the aggregated info from all flows status registers.
There are packets snapped even down to the L2 header, fragments without header or end. The difference between the snapped bandwidth and the full raw bandwidth denotes that either the snap length was small, maybe the default, or somebody actually mangled with the packet content. The average packet load is symmetric for A and B flow, very odd. The protocols used indicate that the traffic is either corporate or the wild. So if you want good traffic with content for your job, I wouldn’t trust that pcap and would send it right back to the customer.
T2 produces also the following files
ls ~/results
annoloc2_flows.txt annoloc2_headers.txt
The header file contains information about the columns of the flow file, such as time, column positions, T2 config, the name of the pcap file, vital interface information, etc. This information makes it easier to reproduce results from different experiments and it is good doc.
cat ~/results/annoloc2_headers.txt
# Date: 1751700318.000650810 sec (Sat 05 Jul 2025 09:25:18 CEST)
# Tranalyzer 0.9.4 (Anteater), Cobra
# Core configuration: L2, IPv4, IPv6
# SensorID: 666
# PID: 7675
# Priority: 0
# Command line: /home/stbf104g/tranalyzer2/tranalyzer2/build/tranalyzer -r /home/stbf104g/tranalyzer-website/tranalyzer/download/data/annoloc2.pcap -w /home/stbf104g/results/
# HW info: mumpfus;Linux;6.15.4-arch2-1;#1 SMP PREEMPT_DYNAMIC Fri, 27 Jun 2025 16:35:07 +0000;x86_64
# SW info: libpcap version 1.10.5 (with TPACKET_V3)
#
# Plugins loaded:
#   01: basicFlow, version 0.9.4
#   02: basicStats, version 0.9.4
#   03: txtSink, version 0.9.4
#
# Col No.	Type	Name	Description
1	C	dir	Flow direction
2	U64	flowInd	Flow index
3	H64	flowStat	Flow status and warnings
4	U64.U32	timeFirst	Date time of first packet
5	U64.U32	timeLast	Date time of last packet
6	U64.U32	duration	Flow duration
7	U8	numHdrDesc	Number of different headers descriptions
8	U16:R	numHdrs	Number of headers (depth) in hdrDesc
9	SC:R	hdrDesc	Headers description
10	MAC:R	srcMac	Mac source
11	MAC:R	dstMac	Mac destination
12	H16	ethType	Ethernet type
13	U16:R	vlanID	VLAN IDs
14	IPX	srcIP	Source IP address
15	SC	srcIPCC	Source IP country
16	S	srcIPOrg	Source IP organization
17	U16	srcPort	Source port
18	IPX	dstIP	Destination IP address
19	SC	dstIPCC	Destination IP country
20	S	dstIPOrg	Destination IP organization
21	U16	dstPort	Destination port
22	U8	l4Proto	Layer 4 protocol
23	U64	pktsSnt	Number of transmitted packets
24	U64	pktsRcvd	Number of received packets
25	I64	padBytesSnt	Number of transmitted padding bytes
26	U64	l7BytesSnt	Number of transmitted layer 7 bytes
27	U64	l7BytesRcvd	Number of received layer 7 bytes
28	U16	minL7PktSz	Minimum layer 7 packet size
29	U16	maxL7PktSz	Maximum layer 7 packet size
30	F	avgL7PktSz	Average layer 7 packet size
31	F	stdL7PktSz	Standard deviation layer 7 packet size
32	F	minIAT	Minimum IAT
33	F	maxIAT	Maximum IAT
34	F	avgIAT	Average IAT
35	F	stdIAT	Standard deviation IAT
36	F	pktps	Sent packets per second
37	F	bytps	Sent bytes per second
38	F	pktAsm	Packet stream asymmetry
39	F	bytAsm	Byte stream asymmetry
Now compare it with the flow file, the columns flowInd to l4Proto originate from basicFlow.
After that and until bytAsym the columns are produced by the basicStats plugin.
Let’s look at the flow file:
tcol ~/results/annoloc2_flows.txt
%dir	flowInd	flowStat	timeFirst	timeLast	duration	numHdrDesc	numHdrs	hdrDesc	srcMac	dstMac	ethType	vlanID	srcIP	srcIPCC	srcIPOrg	srcPort	dstIP	dstIPCC	dstIPOrg	dstPort	l4Proto	pktsSnt	pktsRcvd	padBytesSnt	l7BytesSnt	l7BytesRcvd	minL7PktSz	maxL7PktSz	avgL7PktSz	stdL7PktSz	minIAT	maxIAT	avgIAT	stdIAT	pktps	bytps	pktAsm	bytAsm
A	59	0x0400000200004000	1022171701.692762000	1022171701.692762000	0.000000000	1	3	eth:ipv4:icmp	00:80:48:b3:22:ef	00:d0:02:6d:78:00	0x0800		138.212.187.10	jp	"!ASAHI KASEI CORPORATION"	0	201.116.148.149	mx	"Gestión de direccionamiento Uni"	0	1	1	0	0	28	0	28	28	28	0	0	0	0	0	0	0	1	1
A	107	0x0400000200004000	1022171701.700133000	1022171701.700133000	0.000000000	1	3	eth:ipv4:udp	00:00:1c:b6:1a:53	00:d0:02:6d:78:00	0x0800		138.212.184.165	jp	"!ASAHI KASEI CORPORATION"	8889	19.112.107.128	us	"!Ford Motor Company"	2001	17	1	0	0	254	0	254	254	254	0	0	0	0	0	0	0	1	1
A	136	0x0400000000004000	1022171701.700983000	1022171701.700983000	0.000000000	1	3	eth:ipv4:tcp	00:01:02:b8:58:8a	00:d0:02:6d:78:00	0x0800		138.212.189.36	jp	"!ASAHI KASEI CORPORATION"	1044	205.25.217.73	us	"DNIC-AS-00749"	29981	6	1	0	0	0	0	0	0	0	0	0	0	0	0	0	0	1	0
A	191	0x0400000000004000	1022171701.704267000	1022171701.704267000	0.000000000	1	3	eth:ipv4:tcp	00:48:54:7a:06:6a	00:d0:02:6d:78:00	0x0800		138.212.190.87	jp	"!ASAHI KASEI CORPORATION"	1068	70.128.194.122	us	"ATT-INTERNET4"	1863	6	1	0	6	0	0	0	0	0	0	0	0	0	0	0	0	1	0
A	243	0x0400000200004000	1022171701.706591000	1022171701.706591000	0.000000000	1	3	eth:ipv4:udp	00:04:76:24:0e:f4	00:d0:02:6d:78:00	0x0800		138.212.188.99	jp	"!ASAHI KASEI CORPORATION"	7778	83.221.58.33	de	"DE-WPPSERVICE-20040408"	2009	17	1	0	0	250	0	250	250	250	0	0	0	0	0	0	0	1	1
A	260	0x0c00080200028000	1022171701.707777000	1022171701.707777000	0.000000000	1	4	eth:ipv4:ipv6:UNK(168)	00:d0:02:6d:78:00	00:60:08:2c:ca:8e	0x86dd		cfb6:1c18:5010:faf0:7f66:0:101:80a	-	"-"	0	6c2:6a7f:1:384b:2e35:2e30:2c4d:d100	-	"-"	0	168	1	0	0	20	0	20	20	20	0	0	0	0	0	0	0	1	1
...
A bit more than in NetFlow or Silk, right? You even get your own t2whois DB which tells you right away who is behind an IP. The same service
applies to ethType and MAC addresses if you load the macRecorder. The l7 in front of some columns means that this is the actual layer7 payload size or is based
on the very same. If you change the constant PACKETLENGTH in packetCapture.h or e.g. use t2conf tranalyzer2 -D PACKETLENGTH=2, then you will see the layer4 lengths.
The anteater comes with a powerful post processing language tawk based on awk in order
to select and prepare flow info for further analysis. In order to do so we use a lot of hex coded status variables because each info in the flow has to be multiplied
by the number of flows T2 has to hold in memory. You will experience that selecting flows will be way easier with hex coding. Each bit has a meaning, please refer
to basicFlow.pdf under doc/, e.g., by running t2doc basicFlow or type:
tawk -V column=value
Look at the flow 260, a lot of bits set, so here is the decode.
tawk -V flowStat=0x0c00880200028000The flowStat column with value 0x0c00880200028000 is to be interpreted as follows: bit | flowStat | Description ============================================================================= 15 | 0x0000 0000 0000 8000 | IPv6 flow 17 | 0x0000 0000 0002 0000 | IPv4/6 in IPv4/6 33 | 0x0000 0002 0000 0000 | Acquired packet length < packet length in L3 header 43 | 0x0000 0800 0000 0000 | Stop dissecting: Clipped packet, unhandled protocol or subsequent fragment 58 | 0x0400 0000 0000 0000 | IPv4 packet 59 | 0x0800 0000 0000 0000 | IPv6 packet
Oups, also a L3 header was clipped. That cannot be good. T2 monitors during dissection process all the subsequent headers and has warning bits for L2/3/4 headers, if they are clipped. Here they are:
tawk -V flowStat=0x0000000f00000000The flowStat column with value 0x0000000f00000000 is to be interpreted as follows: bit | flowStat | Description ============================================================================= 32 | 0x0000 0001 0000 0000 | Acquired packet length < minimal L2 datagram 33 | 0x0000 0002 0000 0000 | Acquired packet length < packet length in L3 header 34 | 0x0000 0004 0000 0000 | Acquired packet length < minimal L3 header 35 | 0x0000 0008 0000 0000 | Acquired packet length < minimal L4 header
Let’s say we are only interested to weed out the ones where T2 gave up further dissecting, then use the following tawk command:
tawk 'bitsanyset($flowStat, 0x0000080000000000)' ~/results/annoloc2_flows.txt | tcol
%dir  flowInd  flowStat            timeFirst             timeLast              duration      numHdrDesc  numHdrs  hdrDesc                                                                                              srcMac             dstMac             ethType  vlanID  srcIP                                  srcIPCC  srcIPOrg                            srcPort  dstIP                                    dstIPCC  dstIPOrg                            dstPort  l4Proto  pktsSnt  pktsRcvd  padBytesSnt  l7BytesSnt  l7BytesRcvd  minL7PktSz  maxL7PktSz  avgL7PktSz  stdL7PktSz  minIAT  maxIAT    avgIAT      stdIAT        pktps      bytps      pktAsm      bytAsm
A     260      0x0c00080200028000  1022171701.707777000  1022171701.707777000  0.000000000   1           4        eth:ipv4:ipv6:UNK(168)                                                                               00:d0:02:6d:78:00  00:60:08:2c:ca:8e  0x86dd           cfb6:1c18:5010:faf0:7f66:0:101:80a     -        "-"                                 0        6c2:6a7f:1:384b:2e35:2e30:2c4d:d100      -        "-"                                 0        168      1        0         0            20          0            20          20          20          0           0       0         0           0             0          0          1           1
A     885      0x0c00080200028000  1022171701.810764000  1022171701.810764000  0.000000000   1           4        eth:ipv4:ipv6:UNK(133)                                                                               00:d0:02:6d:78:00  00:60:08:2c:ca:8e  0x86dd           e499:578c:5090:81d0:891b:0:101:80a     -        "-"                                 0        514:2343:2e3c:512:2e35:2e30:2c4d:d100    -        "-"                                 0        133      1        0         0            72          0            72          72          72          0           0       0         0           0             0          0          1           1
A     1894     0x040008d200004000  1022171702.614414000  1022171702.614414000  0.000000000   1           3        eth:ipv4:udp                                                                                         00:80:48:b3:0e:ed  00:d0:02:6d:78:00  0x0800           138.212.188.118                        jp       "!ASAHI KASEI CORPORATION"          0        201.9.46.255                             br       "V tal"                             0        17       1        0         0            52          0            52          52          52          0           0       0         0           0             0          0          1           1
A     3046     0x0c00080200028000  1022171704.484515000  1022171704.484515000  0.000000000   1           4        eth:ipv4:ipv6:UNK(147)                                                                               00:d0:02:6d:78:00  00:a0:c9:07:e0:73  0x86dd           baea:e860:8090:4470:cf67:0:101:50a     -        "-"                                 0        baea:ee14:baeb:2ac:2e35:2e30:2c4d:d100   -        "-"                                 0        147      1        0         0            87          0            87          87          87          0           0       0         0           0             0          0          1           1
A     3451     0x0c00080200028000  1022171705.349871000  1022171705.349871000  0.000000000   1           4        eth:ipv4:ipv6:UNK(126)                                                                               00:d0:02:6d:78:00  00:a0:c9:07:e0:73  0x86dd           d973:ceac:5010:fa94:12db:0:101:80a     -        "-"                                 0        12ea:b284:3:ceeb:2e35:2e30:2c4d:d100     -        "-"                                 0        126      1        0         0            90          0            90          90          90          0           0       0         0           0             0          0          1           1
...
Look at the column hdrDesc. UNK() means unknown, so the dissector saw e.g. in an IPv6 packet some L4 or encapsulated L3 content ended
with protocol 168 or 133, making no sense in the current context.
Hmm, so if you look at the additional bits in the flowStat you realize, there is a reason to it. Mostly the packet ended abruptly,
Damn, who does such a mess? If you generate the packet file using the -s option you will see:
(Note, that it will take some time, because now data for each packet are written to the ~/results/annoloc_packets.txt file)
t2 -r ~/data/annoloc2.pcap -w ~/results/ -s
head -n 5 ~/results/annoloc2_packets.txt | tcol
%pktNo  flowInd  flowStat            time                  pktIAT       pktTrip      flowDuration  numHdrs  hdrDesc       vlanID  srcMac             dstMac             ethType  srcIP            srcIPCC  srcIPOrg                          srcPort  dstIP            dstIPCC  dstIPOrg                  dstPort  l4Proto  pktLen  snapL3Len  snapL4Len  snapL7Len  l3Len  udpLen  l7Len  padLen  l7Content
1       1        0x0400000200004001  1022171701.691172000  0.000000000  0.000000000  0.000000000   3        eth:ipv4:tcp          00:e0:4c:48:3a:a4  00:d0:02:6d:78:00  0x0800   138.212.185.53   jp       !ASAHI KASEI CORPORATION          139      138.212.213.164  jp       !ASAHI KASEI CORPORATION  2133     6        1514    40         20         0          1500   0       1460   0
2       2        0x0400000200004001  1022171701.691174000  0.000000000  0.000000000  0.000000000   3        eth:ipv4:tcp          00:50:fc:44:04:e6  00:d0:02:6d:78:00  0x0800   138.212.188.251  jp       !ASAHI KASEI CORPORATION          20       201.9.21.238     br       V tal                     3649     6        1514    52         32         0          1500   0       1448   0
3       3        0x0400000200004000  1022171701.691176000  0.000000000  0.000000000  0.000000000   3        eth:ipv4:tcp          00:00:1c:b6:14:38  00:d0:02:6d:78:00  0x0800   138.212.188.8    jp       !ASAHI KASEI CORPORATION          4593     138.212.236.233  jp       !ASAHI KASEI CORPORATION  1098     6        1514    40         20         0          1500   0       1460   0
4       4        0x0400000000004000  1022171701.691177000  0.000000000  0.000000000  0.000000000   3        eth:ipv4:tcp          00:d0:02:6d:78:00  00:80:48:b3:21:00  0x0800   138.212.3.176    jp       AKNWS-NET Asahi Kasei Networks C  1099     138.212.184.4    jp       !ASAHI KASEI CORPORATION  139      6        60      40         20         0          40     0       0      6
See? No content, an anonymized pcap. Don’t expect any interesting content in it. But don’t be disappointed, more interesting pcap are supplied in other tutorials! In the packet mode tutorial, we will explain all the nitty-gritty details of the packet file.
Let’s go back to the flow file again.
If you don’t like tabs as a separator, change SEP_CHR from "\t" to any character(s) you like and recompile txtSink.
The simplest method to do that is to use t2conf. If you want to check the present configuration first, use the -G first:
t2conf txtSink -G SEP_CHR
SEP_CHR = "\t"t2conf txtSink -D SEP_CHR=","
t2conf txtSink -G SEP_CHR
SEP_CHR = ","t2build txtSink
t2 -r ~/data/annoloc2.pcap -w ~/results
Now look into the flow file, and you see all separators are ,. Note, that you do not choose separators which
also occur as separators in the columns. If you want to use tawk now, you need the -F ',' option.
tawk -F ',' 'bitsanyset($flowStat, 0x0000080000000000)' ~/results/annoloc2_flows.txt
%dir,flowInd,flowStat,timeFirst,timeLast,duration,numHdrDesc,numHdrs,hdrDesc,srcMac,dstMac,ethType,vlanID,srcIP,srcIPCC,srcIPOrg,srcPort,dstIP,dstIPCC,dstIPOrg,dstPort,l4Proto,pktsSnt,pktsRcvd,padBytesSnt,l7bytesSnt,l7bytesRcvd,minL7PktSz,maxL7PktSz,aveL7PktSz,stdL7PktSz,minIAT,maxIAT,aveIAT,stdIAT,pktps,bytps,pktAsm,bytAsm
A,260,0x0c00080200028000,1022171701.707777000,1022171701.707777000,0.000000000,1,4,eth:ipv4:ipv6:UNK(168),00:d0:02:6d:78:00,00:60:08:2c:ca:8e,0x86dd,,cfb6:1c18:5010:faf0:7f66:0:101:80a,-,"-",0,6c2:6a7f:1:384b::d100,-,"-",0,168,1,0,0,20,0,20,20,20,0,0,0,0,0,0,0,1,1
A,885,0x0c00080200028000,1022171701.810764000,1022171701.810764000,0.000000000,1,4,eth:ipv4:ipv6:UNK(133),00:d0:02:6d:78:00,00:60:08:2c:ca:8e,0x86dd,,e499:578c:5090:81d0:891b:0:101:80a,-,"-",0,514:2343:2e3c:512::d100,-,"-",0,133,1,0,0,72,0,72,72,72,0,0,0,0,0,0,0,1,1
A,1894,0x040008d200004000,1022171702.614414000,1022171702.614414000,0.000000000,1,3,eth:ipv4:udp,00:80:48:b3:0e:ed,00:d0:02:6d:78:00,0x0800,,138.212.188.118,JP,"ASAHI KASEI CORPORATION",0,201.9.46.255,BR,"Not allocated by APNIC",0,17,1,0,0,52,0,52,52,52,0,0,0,0,0,0,0,1,1
A,3046,0x0c00080200028000,1022171704.484515000,1022171704.484515000,0.000000000,1,4,eth:ipv4:ipv6:UNK(147),00:d0:02:6d:78:00,00:a0:c9:07:e0:73,0x86dd,,baea:e860:8090:4470:cf67:0:101:50a,-,"-",0,baea:ee14:baeb:2ac::d100,-,"-",0,147,1,0,0,87,0,87,87,87,0,0,0,0,0,0,0,1,1
A,3451,0x0c00080200028000,1022171705.349871000,1022171705.349871000,0.000000000,1,4,eth:ipv4:ipv6:UNK(126),00:d0:02:6d:78:00,00:a0:c9:07:e0:73,0x86dd,,d973:ceac:5010:fa94:12db:0:101:80a,-,"-",0,12ea:b284:3:ceeb::d100,-,"-",0,126,1,0,0,90,0,90,90,90,0,0,0,0,0,0,0,1,1
...
Alternatively, directly edit the value in utils/bin2txt.h. Here you can control the format of the IP or MAC representation, the time precision, etc in t2 files. Any changes will affect the flow output of all plugins.
vi utils/bin2txt.h
...
/* ========================================================================== */
/* ------------------------ USER CONFIGURATION FLAGS ------------------------ */
/* ========================================================================== */

#define IP4_FORMAT             0 // IPv4 addresses representation:
                                 //     0: normal
                                 //     1: normalized (padded with zeros)
                                 //     2: hexadecimal
                                 //     3: uint32

#define IP6_FORMAT             0 // IPv6 addresses representation:
                                 //     0: compressed
                                 //     1: uncompressed
                                 //     2: one 128-bits hex number
                                 //     3: two 64-bits hex numbers

#define MAC_FORMAT             0 // MAC addresses representation:
                                 //     0: normal (edit MAC_SEP to change the separator)
                                 //     1: one 64-bits hex number
                                 //     2: one 64-bits number

#define HEX_CAPITAL            0 // Hex output: 0: lower case; 1: upper case
#define TFS_EXTENDED_HEADER    0 // Extended header in flow file
#define TFS_NC_TYPE            2 // Types in header file: 0: none, 0: numbers, 1: C types
#define TFS_SAN_UTF8           1 // Activate the UTF-8 sanitizer for strings
#define B2T_TIMESTR            0 // Print Unix timestamps as human readable dates

// JSON
#define JSON_KEEP_EMPTY        0 // Output empty fields
#define JSON_PRETTY            0 // Add spaces to make the output more readable

/* +++++++++++++++++++++ ENV / RUNTIME - conf Variables +++++++++++++++++++++ */

#define MAC_SEP        ":"  // Separator to use in MAC addresses: 11:22:33:44:55:66
#define B2T_NON_IP_STR "-"  // Representation of non-IPv4/IPv6 addresses in IP columns
#define HDR_CHR        "%"  // start characters to label comments
#define SEP_CHR        "\t" // column separator in the flow file
                            // ; . _ and " should not be used

/* ========================================================================== */
/* ------------------------- DO NOT EDIT BELOW HERE ------------------------- */
/* ========================================================================== */
...
Note that some scripts and t2 tools may require additional options if you change the default separator.
So we will stick with tabs for this tutorial. Change it back to "\t" by invoking
t2conf txtSink -D SEP_CHR="\t" && t2build txtSink
Rebuilding is not necessary, as it is below the ENV/RUNTIME marker for env mode 2, but we did it anyway.
t2 -r ~/data/annoloc2.pcap -w ~/results/
Now try to expand your tawk query!
Let’s say all flows of source port 443 and having an issue with the acquired packet length and
where T2 stopped dissecting to prevent overrunning the pcap memory.
A bitwise AND of flowStat and a mask is required and a selection of srcPort 443:
tawk 'bitsanyset($flowStat, 0x0000080f00000000) && sport(443)' ~/results/annoloc2_flows.txt | tcol
%dir  flowInd  flowStat            timeFirst             timeLast              duration     numHdrDesc  numHdrs  hdrDesc       srcMac             dstMac             ethType  vlanID  srcIP           srcIPCC  srcIPOrg         srcPort  dstIP            dstIPCC  dstIPOrg                    dstPort  l4Proto  pktsSnt  pktsRcvd  padBytesSnt  l7BytesSnt  l7BytesRcvd  minL7PktSz  maxL7PktSz  avgL7PktSz  stdL7PktSz  minIAT  maxIAT    avgIAT     stdIAT     pktps     bytps     pktAsm  bytAsm
B     4071     0x0400000200004001  1022171707.227811000  1022171708.640243000  1.412432000  1           3        eth:ipv4:tcp  00:d0:02:6d:78:00  00:50:fc:2c:09:2a  0x0800           70.128.234.203  us       "ATT-INTERNET4"  443      138.212.190.164  jp       "!ASAHI KASEI CORPORATION"  1328     6        13       12        12           3907        917          0           536         300.5385    260.7418    0       0.506266  0.1086486  0.1828124  9.203983  2766.151  0.04    0.6198176
A port 443 response from USA, AT&T to Japan the Asahi Kasei Corp. Interesting, somebody is browsing? If you are really interested in what the person is doing, you need to add
the sslDecode plugin or look into the traffic with httpSniffer, maybe they have a configuration error and everything is plain text. But careful! Look
at the flowStat, it says that even the L4 header is clipped, so these content plugins are useless. In any case, having so many warnings already in your end report,
you should immediately make the guy eat furniture, who gave you this crap. Whoops, that was me. So better not.
Nevertheless, this happens in practice all the time, hence these warning flags are very useful to save valuable analysis time. Play around a little bit and you will discover how easy it is to select and assess the health and utility of specific flows or even whole pcaps.
Sometimes admins are only interested in standard 5 tuples (srcIP, srcPort, dstIP, dstPort, l4Proto), just plain NetFlow 5 output.
To configure that just type the plugin name and open in the src folder basicFlow.h.
basicFlow
vi src/basicFlow.h
Often researchers are only interested in standard NetFlow output. To switch off all L2 and subnet related information residing in basicFlow.h. Here is the default config:
...
#define BFO_SENSORID       0 // Output sensorID

#define BFO_HDRDESC_PKTCNT 0 // Include packet count for header description

#define BFO_MAC            1 // Output MAC addresses
#define BFO_ETHERTYPE      1 // Output EtherType (require IPV6_ACTIVATE == 2 || ETH_ACTIVATE > 0)

#define BFO_MPLS    0 // 0: Do not output MPLS information,
                      // 1: Output MPLS labels,
                      // 2: Output MPLS headers as hex,
                      // 3: Output decoded MPLS headers as label_ToS_S_TTL

#define BFO_VLAN    1 // 0: Do not output VLAN information,
                      // 1: Output VLAN numbers,
                      // 2: Output VLAN headers as hex
                      // 3: Output decoded VLAN headers as TPID_PCP_DEI_VID (TODO)

//#define BFO_GTP     0 // Enable GTP output (TODO)
#define BFO_GRE     0 // Enable GRE output
#define BFO_L2TP    0 // Enable L2TP output
#define BFO_PPP     0 // Enable PPP output
#define BFO_TEREDO  0 // Enable Teredo output

#define BFO_SUBNET_IPLIST      0 // 0: Display only the IP masked by SRCIP[46]CMSK and DSTIP[46]CMSK
                                 // 1: Display a list of IP aggregated

#define BFO_SUBNET_TEST        1 // Enable subnet test on inner IP
#define BFO_SUBNET_TEST_GRE    0 // Enable subnet test on GRE addresses
#define BFO_SUBNET_TEST_L2TP   0 // Enable subnet test on L2TP addresses
#define BFO_SUBNET_TEST_TEREDO 0 // Enable subnet test on Teredo addresses

#define BFO_SUBNET_ASN  0 // Output Autonomous System Numbers (ASN)
#define BFO_SUBNET_LL   0 // Output position (latitude, longitude and reliability)
#define BFO_SUBNET_ORG  1 // Output Organization
#define BFO_SUBNET_HEX  0 // Output the country code and organization information as one 32-bit hex number

// Maximum number of values to store

#define BFO_MAX_HDRDESC 4 // Maximum number of headers descriptions to store
#define BFO_MAX_MAC     3 // Maximum different MAC addresses to output
#define BFO_MAX_IP      5 // Maximum different IP addresses to output
#define BFO_MAX_MPLS    3 // Maximum MPLS headers/tags to output
#define BFO_MAX_VLAN    3 // Maximum VLAN headers/numbers to output
...
Note, that all the other protocol output, such as L2TP, GRE, MPLS, etc are switched off by default, to remove clutter for t2 initiates. Also the detailed geolocation and ASN output is suppressed by default. If you need them later in your life, switch them on.
Now switch off the basic statistics and reverse counts in basicStats.h:
basicStats
vi src/basicStats.h
...
/* ========================================================================== */
/* ------------------------ USER CONFIGURATION FLAGS ------------------------ */
/* ========================================================================== */

#define BS_AGGR_CNT  0  // 1: add A+B counts 0: A+B counts off
#define BS_REV_CNT   1  // 1: add reverse counts from opposite flow, 0: native send counts
#define BS_MOD       0  // > 1: modulo factor of packet length; else: off
#define BS_PAD       1  // 1: aggregated padding bytes

#define BS_STATS     1  // 1: basic statistics, 0: only counts

// The following flags require BS_STATS == 1

#define BS_PL_STATS  1  // 1: basic Packet Length statistics, 0: only counts
#define BS_IAT_STATS 1  // 1: basic IAT statistics, 0: only counts

#define BS_VAR       0  // 0: no var calc, 1: variance
#define BS_STDDEV    1  // 0: no stddev calc, 1: stddev
#define BS_SK        1  // 0: no skew/kurtosis, 1: skew/kurtosis calc, BS_VAR==1

#define BS_XCLD      0  // 0: include all
                        // 1: include (BS_XMIN, UINT16_MAX],
                        // 2: include [0, BS_XMAX),
                        // 3: include [BS_XMIN, BS_XMAX]
                        // 4: exclude (BS_XMIN, BS_XMAX)

/* +++++++++++++++++++++ ENV / RUNTIME - conf Variables +++++++++++++++++++++ */

#define BS_XMIN      1           // if (BS_XCLD) minimal packet length
#define BS_XMAX      UINT16_MAX  // if (BS_XCLD) maximal packet length

/* ========================================================================== */
/* ------------------------- DO NOT EDIT BELOW HERE ------------------------- */
/* ========================================================================== */
...
You could directly edit .h files, but using t2conf is safer and good practice:
t2conf basicFlow -D BFO_MAC=0 -D BFO_ETHERTYPE=0 -D BFO_VLAN=0 -D BFO_SUBNET_TEST=0 -D BFO_MAX_HDRDESC=0
t2conf basicStats -D BS_REV_CNT=0 -D BS_STATS=0 -D BS_PAD=0
Now recompile the two plugins and invoke t2:
t2build basicFlow basicStats
t2 -r ~/data/annoloc2.pcap -w ~/results
And here is your NetFlow 5 output. Lets select all clipped flows:
tawk 'bitsanyset($flowStat, 0x0000080000000000)' ~/results/annoloc2_flows.txt | tcol
%dir  flowInd  flowStat            timeFirst             timeLast              duration      srcIP                                  srcPort  dstIP                      dstPort  l4Proto  pktsSnt  l7bytesSnt
A     260      0x0c00080200028000  1022171701.707777000  1022171701.707777000  0.000000000   cfb6:1c18:5010:faf0:7f66:0:101:80a     0        6c2:6a7f:1:384b::d100      0        168      1        20
A     885      0x0c00080200028000  1022171701.810764000  1022171701.810764000  0.000000000   e499:578c:5090:81d0:891b:0:101:80a     0        514:2343:2e3c:512::d100    0        133      1        72
A     1894     0x040008d200004000  1022171702.614414000  1022171702.614414000  0.000000000   138.212.188.118                        0        201.9.46.255               0        17       1        52
A     3046     0x0c00080200028000  1022171704.484515000  1022171704.484515000  0.000000000   baea:e860:8090:4470:cf67:0:101:50a     0        baea:ee14:baeb:2ac::d100   0        147      1        87
A     3451     0x0c00080200028000  1022171705.349871000  1022171705.349871000  0.000000000   d973:ceac:5010:fa94:12db:0:101:80a     0        12ea:b284:3:ceeb::d100     0        126      1        90
A     3991     0x0400080a00005000  1022171706.878547000  1022171707.000313000  0.121766000   200.134.37.255                         0        138.212.185.216            0        47       2        170
B     3991     0x0400080a00005001  1022171706.931865000  1022171706.962666000  0.030801000   138.212.185.216                        0        200.134.37.255             0        47       2        210
A     4528     0x0c00080200028000  1022171708.439927000  1022171708.439927000  0.000000000   48d5:5fad:50d0:16d0:4a16:0:101:80a     0        53eb:c1d7:86:4d37::d100    0        95       1        75
A     4825     0x0400080a00005000  1022171709.440443000  1022171709.552021000  0.111578000   19.228.184.27                          0        138.212.186.191            0        47       4        162
B     4825     0x0400080a00005001  1022171709.441758000  1022171709.552128000  0.110370000   138.212.186.191                        0        19.228.184.27              0        47       3        166
A     6022     0x0c00080200028000  1022171713.252296000  1022171713.252296000  0.000000000   6f:1256:5050:4402:331e:0:101:50a       0        223:fd3e:223:ff56::d100    0        28       1        81
A     6065     0x0c00080200028000  1022171713.395746000  1022171713.395746000  0.000000000   e29f:74ec:50d0:f53c:98e3:0:101:80a     0        12ea:b5a9:3:cf3b::d100     0        229      1        20
A     6093     0x0c00080200028000  1022171713.450109000  1022171713.450109000  0.000000000   392:fc19:5050:20e2:a7c3:0:101:80a      0        be1:fcff:6ca:1b09::d100    0        64       1        53
A     6172     0x0400085200004000  1022171713.796490000  1022171713.796491000  0.000001000   16.46.171.138                          0        138.212.189.231            0        17       2        2377
A     6912     0x0c00080200028000  1022171716.432198000  1022171716.432198000  0.000000000   75a4:9abd:80d0:4470:b5e2:317b:101:50a  0        75a4:a071:75a4:be39::d100  0        223      1        17
A     7044     0x0c00080200028000  1022171716.967592000  1022171716.967592000  0.000000000   4b9:f24c:8090:4470:4b24:0:101:50a      0        4b9:f800:4ba:c98::d100     0        228      1        20
A     7461     0x0c00080200028000  1022171718.639159000  1022171718.639159000  0.000000000   169e:bdd8:5090:4470:e911:0:101:50a     0        5dc9:ed57:5dc9:f687::d100  0        23       1        118
A     7825     0x0c00080200028000  1022171719.869360000  1022171719.869360000  0.000000000   1439:5c49:5050:4470:c74a:0:101:80a     0        53eb:c64f:86:4da9::d100    0        79       1        112
A     8639     0x0c00080200028000  1022171722.741406000  1022171722.741406000  0.000000000   153c:303:5090:1920:4005:0:101:50a      0        b9bd:772f:b9bd:94f7::d100  0        131      1        45
A     8664     0x0c00080200028000  1022171722.847259000  1022171722.847259000  0.000000000   b2e:42d1:5010:faf0:96fa:0:101:50a      0        e4ba:2af3:e4ba:365b::d100  0        22       1        20
A     8890     0x0c00080200028000  1022171723.637810000  1022171723.637810000  0.000000000   d9d3:fbc:5090:4470:9b77:0:101:80a      0        63c:854c:15b:8f49::d100    0        231      1        87
A     985      0x0400081200004000  1022171701.848919000  1022171726.366145000  24.517226000  201.232.53.168                         3289     138.212.189.228            1533     17       203      203200
A     3894     0x0400080a00005000  1022171706.645144000  1022171726.589552000  19.944408000  201.9.4.49                             0        138.212.191.213            0        47       4        137
B     3894     0x0400080a00005001  1022171706.645835000  1022171726.447349000  19.801514000  138.212.191.213                        0        201.9.4.49                 0        47       5        256
A     98       0x0400081200004000  1022171701.699706000  1022171726.576813000  24.877107000  138.212.188.118                        655      201.9.46.255               655      17       1014     765108
A     1290     0x0400081200004000  1022171702.058266000  1022171726.575284000  24.517018000  16.103.245.128                         1120     138.212.191.249            1461     17       134      103940
A     1291     0x040008f200004000  1022171702.058274000  1022171726.575521000  24.517247000  16.103.245.128                         0        138.212.191.249            0        17       64       94720
A     9708     0x0c00080200028000  1022171726.587705000  1022171726.587705000  0.000000000   e8:3dce:50d0:2180:f660:0:101:80a       0        514:2cf1:2e3c:ec2::d100    0        114      1        55
A     126      0x0400083200004000  1022171701.700965000  1022171726.594434000  24.893469000  16.46.171.138                          4623     138.212.189.231            1490     17       742      952154
A     406      0x0400081200004000  1022171701.717743000  1022171726.607895000  24.890152000  18.14.224.62                           4383     138.212.191.34             2428     17       136      154156
As these flows are clipped and the anteater had to stop parsing, so he shows you what is surely knows so far.
flowInd and flowStat enable you to identify or select flows or connect packets to their flows.
Sometimes people are just into simple boring NetFlow 5 output, so use the following cut command:
tawk 'bitsanyset($flowStat, 0x0000080000000000)' ~/results/annoloc2_flows.txt | cut -f 1,4- | tcol
%dir  timeFirst             timeLast              duration      srcIP                                  srcPort  dstIP                      dstPort  l4Proto  pktsSnt  l7bytesSnt
A     1022171701.707777000  1022171701.707777000  0.000000000   cfb6:1c18:5010:faf0:7f66:0:101:80a     0        6c2:6a7f:1:384b::d100      0        168      1        20
A     1022171701.810764000  1022171701.810764000  0.000000000   e499:578c:5090:81d0:891b:0:101:80a     0        514:2343:2e3c:512::d100    0        133      1        72
A     1022171702.614414000  1022171702.614414000  0.000000000   138.212.188.118                        0        201.9.46.255               0        17       1        52
A     1022171704.484515000  1022171704.484515000  0.000000000   baea:e860:8090:4470:cf67:0:101:50a     0        baea:ee14:baeb:2ac::d100   0        147      1        87
A     1022171705.349871000  1022171705.349871000  0.000000000   d973:ceac:5010:fa94:12db:0:101:80a     0        12ea:b284:3:ceeb::d100     0        126      1        90
A     1022171706.878547000  1022171707.000313000  0.121766000   200.134.37.255                         0        138.212.185.216            0        47       2        170
B     1022171706.931865000  1022171706.962666000  0.030801000   138.212.185.216                        0        200.134.37.255             0        47       2        210
...
As you can see, flowInd and ‘flowStat’ are gone now. There are more tricks with tawk, many of which are discussed in the Post processing with TAWK tutorial.
Now reset basicFlow and basicStats to the default configuration, so change the constants back to 1 and recompile the plugins with t2build.
This time, we will use t2conf to reconfigure the plugin:
t2conf --reset basicFlow basicStats && t2build basicFlow basicStats
Much easier than editing the .h files, right?
Layer 4 based plugins
Now we are adding L4 information which does the following jobs:
| tcpFlags | IP, UDP, TCP aggregated troubleshooting and anomaly status |
| tcpStates | TCP state-machine and RFC checks. Terminates TCP flows properly after a RST or FIN |
Now compile them and run t2:
t2build tcpFlags tcpStates
t2 -r ~/data/annoloc2.pcap -w ~/results... -------------------------------------------------------------------------------- basicStats: Flow max(pktload): 1480 (1.48 K) basicStats: Flow max(b/s), pkts: 19015999488 (19.02 Gb/s), 2 basicStats: Biggest L2 flow talker: 00:d0:02:6d:78:00: 57 [0.00%] packets basicStats: Biggest L2 flow talker: 00:d0:02:6d:78:00: 2622 (2.62 K) [0.00%] bytes basicStats: Biggest L3 flow talker: 138.212.189.38 (JP): 23601 (23.60 K) [1.94%] packets basicStats: Biggest L3 flow talker: 138.212.189.38 (JP): 33731054 (33.73 M) [52.64%] bytes tcpFlags: Aggregated ipFlags=0x7964 tcpFlags: Aggregated tcpFStat=0x5fff tcpFlags: Aggregated tcpFlags=0x07ff tcpFlags: Aggregated tcpAnomaly=0x23ff tcpFlags: Aggregated ipToS=0xff tcpFlags: Number of TCP scans attempted, successful: 970, 875 [90.21%] tcpFlags: Number of TCP SYN retries, seq retries: 147, 5286 (5.29 K) tcpFlags: Number WinSz below 1: 1280 (1.28 K) [0.13%] tcpStates: Aggregated tcpStatesAFlags=0xdf -------------------------------------------------------------------------------- ...
Note that additional aggregated fields appear between the ------ lines of the end report.
As in flowStat the hex numbers denote aggregated protocol or anomaly information.
Note that there are 1443 flows where the TCP window size drops to 0.
There are also several retries and scans detected.
Now you have NetFlow 9/10 + a bit more. Let’s say your company imposed the rule that nobody should communicate with China, because there are no business ties with this country. So he comes to you and demands the answer to the following question: Is there any traffic initiating connection egress to China?
Ok, here is the translation into tawk:
tawk '(bitsanyset($flowStat, 1) == 0 && ($dstIPCC == "cn")) || hdr() { print $srcIP, $srcIPCC, $dstIP, $dstIPCC }' ~/results/annoloc2_flows.txt | tcol
srcIP            srcIPCC  dstIP            dstIPCC
138.212.187.203  jp       36.176.200.106   cn
138.212.187.203  jp       36.176.200.106   cn
138.212.187.203  jp       36.176.200.106   cn
138.212.190.120  jp       36.177.136.137   cn
138.212.190.107  jp       36.108.11.91     cn
138.212.190.107  jp       36.177.136.137   cn
138.212.190.107  jp       36.208.118.91    cn
138.212.190.107  jp       36.108.11.91     cn
138.212.190.107  jp       36.160.217.83    cn
...
Here you have a list of IPs communicating to China. The lowest bit in bitsanyset($flowStat, 1) denotes the initiation of the connection, a 0 means
the srcIP started the flow. The hdr() command adds the header to the resulting output, which otherwise would be filtered.
Now look at all TCP flows egress to China:
tawk '($dstIPCC == "cn" && tcp()) || hdr()' ~/results/annoloc2_flows.txt | tcol
%dir  flowInd  flowStat            timeFirst             timeLast              duration      numHdrDesc  numHdrs  hdrDesc       srcMac             dstMac             ethType  vlanID  srcIP            srcIPCC  srcIPOrg                    srcPort  dstIP            dstIPCC  dstIPOrg                            dstPort  l4Proto  pktsSnt  pktsRcvd  padBytesSnt  l7BytesSnt  l7BytesRcvd  minL7PktSz  maxL7PktSz  avgL7PktSz  stdL7PktSz  minIAT  maxIAT    avgIAT      stdIAT      pktps      bytps     pktAsm        bytAsm       tcpFStat  ipMindIPID  ipMaxdIPID  ipMinTTL  ipMaxTTL  ipTTLChg  ipToS  ipFlags  ipOptCnt  ipOptCpCl_Num    ip6OptCntHH_D  ip6OptHH_D             tcpISeqN    tcpPSeqCnt  tcpSeqSntBytes  tcpSeqFaultCnt  tcpPAckCnt  tcpFlwLssAckRcvdBytes  tcpAckFaultCnt  tcpBFlgtMx  tcpInitWinSz  tcpAvgWinSz  tcpMinWinSz  tcpMaxWinSz  tcpWinSzDwnCnt  tcpWinSzUpCnt  tcpWinSzChgDirCnt  tcpWinSzThRt  tcpFlags  tcpAnomaly  tcpJA4T                             tcpOptPktCnt  tcpOptCnt  tcpOptions  tcpMSS  tcpWS  tcpMPTBF  tcpMPF  tcpMPAID  tcpMPDSSF  tcpTmS      tcpTmER     tcpEcI  tcpUtm           tcpBtm                 tcpSSASAATrip  tcpRTTAckTripMin  tcpRTTAckTripMax  tcpRTTAckTripAvg  tcpRTTAckTripJitAvg  tcpRTTSseqAA  tcpRTTAckJitAvg  tcpStatesAFlags
B     2208     0x0400000200004001  1022171703.077130000  1022171703.077130000  0.000000000   1           3        eth:ipv4:tcp  00:05:02:a7:59:98  00:d0:02:6d:78:00  0x0800           138.212.184.140  jp       "!ASAHI KASEI CORPORATION"  5500     36.204.73.10     cn       "CTTNET China TieTong Telecommuni"  57019    6        1        1         0            11          0            11          11          11          0           0       0         0           0           0          0         0             1            0x0011    65535       0           255       255       0         0x00   0x1840   0         0x00_0x00000000  0_0            0x00000000_0x00000000  0           1           0               0               1           0                      0               0           0             0            0            0            0               0              0                  0             0x0454    0x2000      0_00_00_00                          0             0          0x00000000  0       0      0x0000    0x00    0         0x00       0           0           0       0.000000         0.000000000            0              65535             0                 0                 0                    0.03941       0                0x43
A     3099     0x0400000000004000  1022171704.554485000  1022171704.554485000  0.000000000   1           3        eth:ipv4:tcp  00:60:08:78:1b:63  00:d0:02:6d:78:00  0x0800           138.212.187.203  jp       "!ASAHI KASEI CORPORATION"  1825     36.176.200.106   cn       "CHINAMOBILE-CN China Mobile Comm"  4567     6        1        1         0            0           0            0           0           0           0           0       0         0           0           0          0         0             0            0x0011    65535       0           128       128       0         0x00   0x0840   0         0x00_0x00000000  0_0            0x00000000_0x00000000  3569114039  0           0               0               0           0                      0               0           16384         16384        16384        16384        0               0              0                  0             0x0002    0x3000      16384_2-1-1-41460_00                1             4          0x00000016  1460    0      0x0000    0x00    0         0x00       0           0           0       0.000000         0.000000000            0.108845       0.108845          0.108845          0.108845          0                    0.108845      0                0x03
B     3350     0x0400000000004001  1022171705.071644000  1022171705.071644000  0.000000000   1           3        eth:ipv4:tcp  00:50:bf:59:85:48  00:d0:02:6d:78:00  0x0800           138.212.188.67   jp       "!ASAHI KASEI CORPORATION"  1214     58.204.250.125   cn       "ERX-CERNET-BKB China Education a"  4120     6        1        1         6            0           0            0           0           0           0           0       0         0           0           0          0         0             0            0x0011    65535       0           128       128       0         0x00   0x0800   0         0x00_0x00000000  0_0            0x00000000_0x00000000  0           1           0               0               1           0                      0               0           0             0            0            0            0               0              0                  0             0x04d4    0x2000      0_00_00_00                          0             0          0x00000000  0       0      0x0000    0x00    0         0x00       0           0           0       0.000000         0.000000000            0              65535             0                 0                 0                    0.008885      0                0x43
A     3375     0x0400000000004000  1022171705.145409000  1022171705.145409000  0.000000000   1           3        eth:ipv4:tcp  00:60:08:78:1b:63  00:d0:02:6d:78:00  0x0800           138.212.187.203  jp       "!ASAHI KASEI CORPORATION"  1825     36.176.200.106   cn       "CHINAMOBILE-CN China Mobile Comm"  4567     6        1        1         0            0           0            0           0           0           0           0       0         0           0           0          0         0             0            0x0011    65535       0           128       128       0         0x00   0x0840   0         0x00_0x00000000  0_0            0x00000000_0x00000000  3569114039  0           0               0               0           0                      0               0           16384         16384        16384        16384        0               0              0                  0             0x0002    0x3000      16384_2-1-1-41460_00                1             4          0x00000016  1460    0      0x0000    0x00    0         0x00       0           0           0       0.000000         0.000000000            0.111789       0.111789          0.111789          0.111789          0                    0.111789      0                0x03
B     3615     0x0400000000004001  1022171705.707891000  1022171705.707891000  0.000000000   1           3        eth:ipv4:tcp  00:00:1c:b6:16:3f  00:d0:02:6d:78:00  0x0800           138.212.185.186  jp       "!ASAHI KASEI CORPORATION"  6346     36.153.30.56     cn       "CMNET-JIANGSU-AP China Mobile co"  4579     6        1        1         6            0           0            0           0           0           0           0       0         0           0           0          0         0             0            0x0011    65535       0           127       127       0         0x00   0x0800   0         0x00_0x00000000  0_0            0x00000000_0x00000000  0           1           0               0               1           0                      0               0           0             0            0            0            0               0              0                  0             0x0454    0x2000      0_00_00_00                          0             0          0x00000000  0       0      0x0000    0x00    0         0x00       0           0           0       0.000000         0.000000000            0              65535             0                 0                 0                    0.002816      0                0x43
...
So no business ties to China. Is it still legal traffic…? Is there malware in the company? There is seriously something fishy.
Now let’s look for IP/TCP anomalies, such as broken fragmentation, aka fragmentation positional errors, or abnormal flag combinations appearing in IP packets.
The tcpFlags plugin output the ipFlags column, which contains all information about the IP header, such as fragmentation, checksum or option
anomalies. Let’s look at it:
The ipFlags column is to be interpreted as follows:

   bit | ipFlags | Description
   =============================================================================
     0 | 0x0001  | IP options corrupt
     1 | 0x0002  | IPv4 packets out of order
     2 | 0x0004  | IPv4 ID roll over
     3 | 0x0008  | IP fragment below minimum

     4 | 0x0010  | IP fragment out of range
     5 | 0x0020  | More Fragment bit
     6 | 0x0040  | IPv4: Don't Fragment bit, IPv6: reserve bit
     7 | 0x0080  | Reserve bit

     8 | 0x0100  | Fragmentation position error
     9 | 0x0200  | Fragmentation sequence error
    10 | 0x0400  | L3 checksum error
    11 | 0x0800  | L4 checksum error

    12 | 0x1000  | Length in L3 Header < actual L3 length
    13 | 0x2000  | Packet inter-distance = 0
    14 | 0x4000  | Packet inter-distance < 0
    15 | 0x8000  | TCP SYN flag with L7 content
So select all flows with fragmentation anomalies:
tawk 'bitsanyset($ipFlags, 0x0318)' ~/results/annoloc2_flows.txt | tcol
...Now let’s look for TCP anomalies.
The tcpFlags plugin outputs the tcpFStat column, which describes the general status of the plugin and
contains layer 4 information about protocols such as TCP, UDP and MPTCP. Also internal bits for the window state-machine
and info about L4 options and windows flow control anomalies for troubleshooting,
e.g., configurable back-pressure detection: Min Window detected or Window full.
The tcpFStat column is to be interpreted as follows:

   bit | tcpFStat | Description
   =============================================================================
     0 | 0x0001   | Packet good for inter-distance assessment
     1 | 0x0002   | TCP option init
     2 | 0x0004   | Timestamp option decreasing
     3 | 0x0008   | L4 option field corrupt or not acquired

     4 | 0x0010   | Window state-machine initialized
     5 | 0x0020   | Window update
     6 | 0x0040   | Win 0 probe
     7 | 0x0080   | Win 0 probe ACK

     8 | 0x0100   | Min Window detected
     9 | 0x0200   | WS used
    10 | 0x0400   | Window full
    11 | 0x0800   | Window state-machine count up(1)/down(0)

    12 | 0x1000   | L4 Checksum calculation if present
    13 | 0x2000   | UDPLITE Checksum coverage error
    14 | 0x4000   | TCP Selective ACK Option
    15 | 0x8000   | MPTCP detected
tcpFlags is 16 bits long in contrast to the 8-bit NetFlow field.
It contains in the lower byte the well known aggregation of
the TCP flags. In the higher bytes all sorts of combination
of bits. So you can distinguish the appearance of a SYN_ACK
or the SYN and an ACK in a later packet. Moreover certain
malicious flag combinations reside above bit 11.
The tcpFlags column is to be interpreted as follows:

   bit | tcpFlags | Description
   =============================================================================
     0 | 0x0001     | FIN: No more data, finish connection
     1 | 0x0002     | SYN: Synchronize sequence numbers
     2 | 0x0004     | RST: Reset connection
     3 | 0x0008     | PSH: Push data

     4 | 0x0010     | ACK: Acknowledgement field value valid
     5 | 0x0020     | URG: Urgent pointer valid
     6 | 0x0040     | ECE: ECN-Echo
     7 | 0x0080     | CWR: Congestion Window Reduced flag is set

     8 | 0x0100     | FIN_ACK: Acknowledgement of FIN
     9 | 0x0200     | SYN_ACK: Acknowledgement of SYN
    10 | 0x0400     | RST_ACK: Acknowledgement of RST
    11 | 0x0800     | Potential NULL scan packet or malicious channel

    12 | 0x1000     | SYN-FIN flag, scan or malicious packet
    13 | 0x2000     | SYN-FIN-RST flag, potential malicious scan packet or channel
    14 | 0x4000     | FIN-RST flag, abnormal flow termination
    15 | 0x8000     | Potential Xmas scan packet or malicious channel
tcpAnomaly denotes all faults that might happen in TCP flow and error control.
In combination with window bits in tcpFStat they give you a complete picture
about the health of a connection/flow or per packet.
Since 0.8.14 the code was refactored to increase compatibility with Wireshark output. Hence, easier to interpret for troubleshooters.
tawk -V tcpAnomalyThe tcpAnomaly column is to be interpreted as follows: bit | tcpAnomaly | Description ============================================================================= 0 | 0x0001 | SYN retransmission 1 | 0x0002 | SEQ Timeout retransmission 2 | 0x0004 | SEQ Fast retransmission 3 | 0x0008 | Duplicate ACK 4 | 0x0010 | TCP Keep-Alive 5 | 0x0020 | TCP Keep-Alive ACK 6 | 0x0040 | Sequence number out-of-order 7 | 0x0080 | Sequence mess, rather spurious Retransmission 8 | 0x0100 | ACK for unseen packet 9 | 0x0200 | Previous packet not captured 10 | 0x0400 | - 11 | 0x0800 | - 12 | 0x1000 | Scan detected in flow 13 | 0x2000 | Successful scan detected in flow 14 | 0x4000 | TCP SYN flag with L7 content 15 | 0x8000 | -
So let’s select the bits in tcpAnomaly relevant for TCP flow control and error control trouble.
tawk 'bitsanyset($tcpAnomaly, 0x00ff)' ~/results/annoloc2_flows.txt | tcol
%dir  flowInd  flowStat            timeFirst             timeLast              duration      numHdrDesc  numHdrs  hdrDesc            srcMac             dstMac             ethType  vlanID  srcIP                                    srcIPCC  srcIPOrg                            srcPort  dstIP                                    dstIPCC  dstIPOrg                            dstPort  l4Proto  pktsSnt  pktsRcvd  padBytesSnt  l7BytesSnt  l7BytesRcvd  minL7PktSz  maxL7PktSz  avgL7PktSz  stdL7PktSz  minIAT  maxIAT      avgIAT        stdIAT       pktps       bytps       pktAsm         bytAsm         tcpFStat  ipMindIPID  ipMaxdIPID  ipMinTTL  ipMaxTTL  ipTTLChg  ipToS  ipFlags  ipOptCnt  ipOptCpCl_Num    ip6OptCntHH_D  ip6OptHH_D             tcpISeqN    tcpPSeqCnt  tcpSeqSntBytes  tcpSeqFaultCnt  tcpPAckCnt  tcpFlwLssAckRcvdBytes  tcpAckFaultCnt  tcpBFlgtMx  tcpInitWinSz  tcpAvgWinSz   tcpMinWinSz  tcpMaxWinSz  tcpWinSzDwnCnt  tcpWinSzUpCnt  tcpWinSzChgDirCnt  tcpWinSzThRt  tcpFlags  tcpAnomaly  tcpJA4T                                          tcpOptPktCnt  tcpOptCnt  tcpOptions  tcpMSS  tcpWS  tcpMPTBF  tcpMPF  tcpMPAID  tcpMPDSSF  tcpTmS      tcpTmER     tcpEcI  tcpUtm            tcpBtm                 tcpSSASAATrip  tcpRTTAckTripMin  tcpRTTAckTripMax  tcpRTTAckTripAvg  tcpRTTAckTripJitAvg  tcpRTTSseqAA  tcpRTTAckJitAvg  tcpStatesAFlags
A     1586     0x0400000200004000  1022171702.282482000  1022171702.358266000  0.075784000   1           3        eth:ipv4:tcp       00:d0:02:6d:78:00  00:50:da:70:78:c6  0x0800           130.92.198.110                           ch       "Universitaet Bern"                 1249     138.212.191.248                          jp       "!ASAHI KASEI CORPORATION"          1214     6        9        8         13           27          3069         0           22          3           7.488036    0       0.025709    0.008420445   0.01302839   118.7586    356.2757    0.05882353     -0.9825581     0x4811    1           2           114       114       0         0x00   0x1840   0         0x00_0x00000000  0_0            0x00000000_0x00000000  56530521    8           27              0               8           1610                   3               22          16384         17454.51      16384        17520        0               1              1                  0             0x01db    0x0088      16384_2-1-1-41460_00                             5             16         0x00000036  1460    0      0x0000    0x00    0         0x00       0           0           0       0.000000          0.000000000            0.001468032    0.000170016       0.002490016       0.001384636       0.001052551          0.02344102    0                0x12
B     1586     0x0400000200004001  1022171702.283950000  1022171702.359153000  0.075203000   1           3        eth:ipv4:tcp       00:50:da:70:78:c6  00:d0:02:6d:78:00  0x0800           138.212.191.248                          jp       "!ASAHI KASEI CORPORATION"          1214     130.92.198.110                           ch       "Universitaet Bern"                 1249     6        8        9         24           3069        27           0           1460        383.625     766.9951    0       0.025933    0.009400375   0.01381703   106.3787    40809.54    -0.05882353    0.9825581      0x0011    1           1           128       128       0         0x00   0x5840   0         0x00_0x00000000  0_0            0x00000000_0x00000000  203521076   4           1609            1               5           5                      0               1609        64240         22033.02      0            64240        2               0              0                  0             0x03df    0x0044      64240_2-1-1-41460_00                             1             4          0x00000016  1460    0      0x0000    0x00    0         0x00       0           0           0       0.000000          0.000000000            0.02197299     0.000116992       0.02344397        0.015461          0.010821             0.01684563    0.01087207       0x52
A     2096     0x0400000200004000  1022171702.849399000  1022171702.868263000  0.018864000   1           3        eth:ipv4:tcp       00:d0:02:6d:78:00  00:80:48:b3:22:c4  0x0800           19.134.193.89                            us       "!Ford Motor Company"               3167     138.212.189.66                           jp       "!ASAHI KASEI CORPORATION"          1214     6        2        2         0            2920        0            1460        1460        1460        0           0       0.018864    0.009432      0.01333886   106.022     154792.2    0              1              0x0011    1           1           113       113       0         0x1c   0x1840   0         0x00_0x00000000  0_0            0x00000000_0x00000000  342665897   2           1460            0               2           0                      0               1460        17506         17506         17506        17506        0               0              0                  0             0x0050    0x0080      17506_00_00_00                                   0             0          0x00000000  0       0      0x0000    0x00    0         0x00       0           0           0       0.000000          0.000000000            0              4.9024e-05        0.00103104        0.000540032       0.0006952549         0             0                0x13
A     2526     0x0400000200004000  1022171703.498469000  1022171703.725075000  0.226606000   1           3        eth:ipv4:tcp       00:d0:02:6d:78:00  00:80:48:b3:22:c4  0x0800           216.244.43.210                           us       "AMAZON-02"                         1760     138.212.189.66                           jp       "!ASAHI KASEI CORPORATION"          1214     6        7        6         6            7200        0            0           1440        1028.571    708.4792    0       0.065174    0.03237228    0.0325257    30.89062    31773.21    0.07692308     1              0x4011    1           4           117       117       0         0x00   0x1840   0         0x00_0x00000000  0_0            0x00000000_0x00000000  1097183880  6           7200            0               6           0                      1               5760        64786         45350.2       0            64786        1               0              0                  0             0x0014    0x0088      64786_00_00_00                                   1             3          0x00000022  0       0      0x0000    0x00    0         0x00       0           0           0       0.000000          0.000000000            0              1.4016e-05        0.002257984       0.001038832       0.001111025          0             0                0x13
...
Look at flow 1586. Not only sequence mess and duplicates ACK, and resulting retransmits, but also all sorts of malicious flags in tcpFlags.
Damn!! Is that real? Always check your 6, right? So have a look at the flowStat:
The flowStat column with value 0x0400000200004000 is to be interpreted as follows:

   bit | flowStat              | Description
   =============================================================================
    14 | 0x0000 0000 0000 4000 | IPv4 flow
    33 | 0x0000 0002 0000 0000 | Acquired packet length < packet length in L3 header
    58 | 0x0400 0000 0000 0000 | IPv4 packet
Right, the L3 header is clipped, so all the bits might be unreliable.
The tcpStates plugin follows the TCP state-machine and monitors the correct RFC progression of a TCP connection. It supplies only one column.
tawk -V tcpStatesAFlags
The tcpStatesAFlags column is to be interpreted as follows:

   bit | tcpStatesAFlags | Description
   =============================================================================
     0 | 0x01            | Malformed connection establishment
     1 | 0x02            | Malformed teardown
     2 | 0x04            | Malformed flags during established connection
     3 | 0x08            | Packets detected after teardown

     4 | 0x10            | Packets detected after reset
     5 | 0x20            | -
     6 | 0x40            | Reset from sender
     7 | 0x80            | Potential evil behavior (scan)
Note, that even normal applications can produce such malformed flag combinations, especially from a specific OS: Windows. Look a bit for yourself, whether the bits in flow 1586 are really valid.
The tcpFlags plugin also contains parameters and counter to monitor L4 error/flow control, bandwidth/Round Trip Times (RTT) and some tricks for security guys.
By default all detectors are enabled in tcpFlags.h.
tcpFlags
vi src/tcpFlags.h
...
/* ========================================================================== */
/* ------------------------ USER CONFIGURATION FLAGS ------------------------ */
/* ========================================================================== */

#define IPTOS            0 // IPv4 ToS / IPv6 Class:
                           //   0: IP ToS hex
                           //   1: DSCP_ECN dec
                           //   2: Precedence(1-7)_ECN

#define RTT_ESTIMATE     1 // 1: Round trip time estimation
#define IPCHECKSUM       2 // Checksum calculation
                           //   0: No checksum calculation
                           //   1: Calculation of L3 (IP) header checksum
                           //   2: Calculation of L3 (IP) and L4 (TCP, UDP, ...) checksum

#define WINDOWSIZE       1 // 1: Calculation of TCP window size parameters
#define WINMIN           1 // Minimal window size threshold defining a healthy communication
                           // (only packets below the threshold are counted)
#define SEQ_ACK_NUM      1 // 1: SEQ/ACK number feature analysis
#define FRAG_ANALYZE     1 // 1: Fragmentation analysis
#define NAT_BT_EST       1 // 1: NAT boot time estimation
#define SCAN_DETECTOR    1 // 1: Scan flow detector
#define MPTCP            1 // 1: Dissect MPTCP

// The following options require SEQ_ACK_NUM = 1

#define SPKTMD_SEQACKREL 0 // SEQ/ACK numbers representation (-s option):
                           //   0: absolute,
                           //   1: relative

#define SPKTMD_SEQACKHEX 0 // SEQ/ACK numbers representation (-s option):
                           //   0: uint32_t
                           //   1: hex32

/* +++++++++++++++++++++ ENV / RUNTIME - conf Variables +++++++++++++++++++++ */

/*         No env / runtime configuration flags available for tcpFlags        */

/* ========================================================================== */
/* ------------------------- DO NOT EDIT BELOW HERE ------------------------- */
/* ========================================================================== */
...
You can switch off the RTT estimation, calculation of checksums, the TCP window size features or the tricks with TCP SEQ/ACK numbers. Although fragmentation in IPv4 today is mostly fishy, if you are not interested in it, switch it off. So the code becomes smaller and faster.
For a much more detailed tutorial, refer to the IP/TCP Troubleshooting and hidden figures.
Basic traffic volume and connection analysis
To acquire an overview about a network and its communication behavior, a graphical output is definitely helpful.
graphviz is a wonderful program producing all kinds of graphs.
T2 supplies a conversion script t2viz which you may expand for your own purposes.
You also need to install the image viewer feh.
One basic approach is to look into the connection matrix or simply the connections between nodes. In the script, the graph edges are tagged with
flowStatdirection (AorB), land of origin,tcpAnomaly,srcPort-dstPort,l7BytesSnt,l7BytesRcvd.- Initiating flow (
A): green, Response flow (B): red - Width:
l7BytesSnt
Let’s select a subset from the flow file in order to reduce the execution time of graphviz.
Then apply the reduced flow file to t2viz:
head -n 43 ~/results/annoloc2_flows.txt > ~/results/reduced_flows.txt
t2viz ~/results/reduced_flows.txt -w l7BytesSnt
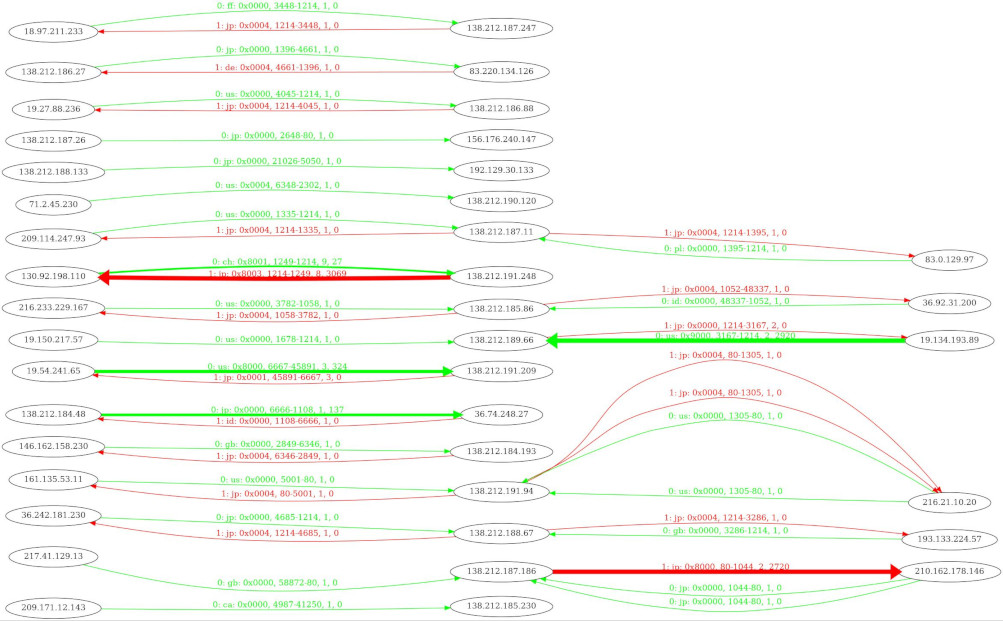
Or if you like a picture, use one of --gif, --jpeg, --png or --svg option:
t2viz ~/results/reduced_flows.txt -w l7BytesSnt -n --png ~/results/reduced_flows_graph.png
feh ~/results/reduced_flows_graph.png
If we had the full traffic plotted then you could identify large or biggest talkers, just by looking for the arrow with the largest
width. But note that with larger number of flows, the performance of graphviz degrades rapidly.
We produced a netgrapher which can handle very large connection matrices. Unfortunately this is not open source currently.
If you are interested to contact us here.
Another method to find biggest talkers is to reverse sort with tawk.
For example, we can extract the flows which sent the most packets (pktsSnt) with the following command:
tawk 't2sort(pktsSnt, 4)' ~/results/annoloc2_flows.txt | tcol
%dir  flowInd  flowStat            timeFirst             timeLast              duration      numHdrDesc  numHdrs  hdrDesc       srcMac             dstMac             ethType  vlanID  srcIP           srcIPCC  srcIPOrg                            srcPort  dstIP            dstIPCC  dstIPOrg                            dstPort  l4Proto  pktsSnt  pktsRcvd  padBytesSnt  l7BytesSnt  l7BytesRcvd  minL7PktSz  maxL7PktSz  avgL7PktSz  stdL7PktSz  minIAT  maxIAT    avgIAT        stdIAT       pktps     bytps     pktAsm     bytAsm      tcpFStat  ipMindIPID  ipMaxdIPID  ipMinTTL  ipMaxTTL  ipTTLChg  ipToS  ipFlags  ipOptCnt  ipOptCpCl_Num    ip6OptCntHH_D  ip6OptHH_D             tcpISeqN    tcpPSeqCnt  tcpSeqSntBytes  tcpSeqFaultCnt  tcpPAckCnt  tcpFlwLssAckRcvdBytes  tcpAckFaultCnt  tcpBFlgtMx  tcpInitWinSz  tcpAvgWinSz  tcpMinWinSz  tcpMaxWinSz  tcpWinSzDwnCnt  tcpWinSzUpCnt  tcpWinSzChgDirCnt  tcpWinSzThRt  tcpFlags  tcpAnomaly  tcpJA4T             tcpOptPktCnt  tcpOptCnt  tcpOptions  tcpMSS  tcpWS  tcpMPTBF  tcpMPF  tcpMPAID  tcpMPDSSF  tcpTmS  tcpTmER  tcpEcI  tcpUtm    tcpBtm       tcpSSASAATrip  tcpRTTAckTripMin  tcpRTTAckTripMax  tcpRTTAckTripAvg  tcpRTTAckTripJitAvg  tcpRTTSseqAA  tcpRTTAckJitAvg  tcpStatesAFlags
B     91       0x0400000200004001  1022171701.699480000  1022171726.636773000  24.937293000  1           3        eth:ipv4:tcp  00:00:21:d2:cc:72  00:d0:02:6d:78:00  0x0800           138.212.189.38  jp       "!ASAHI KASEI CORPORATION"          139      138.212.86.201   jp       "AKNWS-NET Asahi Kasei Networks C"  3429     6        23601    12342     0            33731054    42462        6           1460        1429.221    189.2884    0       0.253336  0.001056625   0.003716458  946.4139  1352635   0.313246   0.9974855   0x0011    1           39          64        64        0         0x10   0x5840   0         0x00_0x00000000  0_0            0x00000000_0x00000000  3624816249  23376       34471811        24              23601       42651                  10              10079       33232         33232        33232        33232        0               0              0                  0             0x0098    0x0344      33232_00_00_0       0             0          0x00000000  0       1      0x0000    0x00    0         0x00       0       0        0       0.000000  0.000000000  0              0                 0.110333          0.0002984817      0.001135286          0.002293069   0.00436281       0x03
A     91       0x0400000a00004000  1022171701.699996000  1022171726.637210000  24.937214000  1           3        eth:ipv4:tcp  00:d0:02:6d:78:00  00:00:21:d2:cc:72  0x0800           138.212.86.201  jp       "AKNWS-NET Asahi Kasei Networks C"  3429     138.212.189.38   jp       "!ASAHI KASEI CORPORATION"          139      6        12342    23601     68670        42462       33731054     0           63          3.440447    14.32136    0       0.36365   0.002020519   0.005329602  494.923   1702.756  -0.313246  -0.9974855  0x4819    1           21          127       127       0         0x00   0x1840   0         0x00_0x00000000  0_0            0x00000000_0x00000000  3835254416  12339       42651           0               12342       34124331               236             63          17520         17518.91     16201        17520        355             355            355                0             0x0098    0x0308      17520_00_00_0       169           507        0x00000022  0       1      0x0000    0x00    0         0x00       0       0        0       0.000000  0.000000000  0              0                 0.253317          0.001994587       0.00421251           0             0                0x03
B     6343     0x0400000200004001  1022171714.045827000  1022171722.457644000  8.411817000   1           3        eth:ipv4:tcp  00:d0:02:6d:78:00  00:10:5a:c5:96:1a  0x0800           139.45.174.202  us       "STRIPE-139-45-174-0-24"            56071    138.212.190.117  jp       "!ASAHI KASEI CORPORATION"          3837     6        10159    5692      6            14821880    0            0           1460        1458.99     32.96766    0       1.465593  0.0008280156  0.01485064   1207.706  1762031   0.2818119  1           0x0411    21426       33832       59        250       1         0x18   0x5844   0         0x00_0x00000000  0_0            0x00000000_0x00000000  1837334633  10104       15000001        0               10159       0                      0               17520       5840          5840         5840         5840         0               0              0                  0             0x03db    0x0200      5840_2-1-1-41460_0  1             4          0x00000016  1460    1      0x0000    0x00    0         0x00       0       0        0       0.000000  0.000000000  0.00025        0                 1.460059          0.0008329496      0.01935957           0.002583705   0.01976381       0x02
B     3609     0x0400000200004001  1022171705.686717000  1022171714.043794000  8.357077000   1           3        eth:ipv4:tcp  00:d0:02:6d:78:00  00:10:5a:c5:96:1a  0x0800           139.45.174.202  us       "STRIPE-139-45-174-0-24"            56070    138.212.190.117  jp       "!ASAHI KASEI CORPORATION"          3820     6        10048    5709      6            14656900    0            0           1460        1458.688    37.40672    0       1.39519   0.0008317156  0.01430882   1202.334  1753831   0.2753697  1           0x0411    10484       44772       59        250       1         0x18   0x5844   0         0x00_0x00000000  0_0            0x00000000_0x00000000  1835183641  9968        15000001        0               10048       0                      0               17520       5840          5840         5840         5840         0               0              0                  0             0x03db    0x0200      5840_2-1-1-41460_0  1             4          0x00000016  1460    1      0x0000    0x00    0         0x00       0       0        0       0.000000  0.000000000  0.000222016    0                 1.389116          0.0007997913      0.01838541           0.002785257   0.01894454       0x02
Note that the number 4 in the tawk statement above denotes the number of lines to display.
If you omit it, all lines will be displayed.
We can also extract the four flows which sent the most bytes (l7BytesSnt):
tawk 't2sort(l7BytesSnt, 4)' ~/results/annoloc2_flows.txt | tcol
%dir  flowInd  flowStat            timeFirst             timeLast              duration      numHdrDesc  numHdrs  hdrDesc       srcMac             dstMac             ethType  vlanID  srcIP           srcIPCC  srcIPOrg                    srcPort  dstIP            dstIPCC  dstIPOrg                            dstPort  l4Proto  pktsSnt  pktsRcvd  padBytesSnt  l7BytesSnt  l7BytesRcvd  minL7PktSz  maxL7PktSz  avgL7PktSz  stdL7PktSz  minIAT  maxIAT    avgIAT        stdIAT       pktps     bytps     pktAsm     bytAsm     tcpFStat  ipMindIPID  ipMaxdIPID  ipMinTTL  ipMaxTTL  ipTTLChg  ipToS  ipFlags  ipOptCnt  ipOptCpCl_Num    ip6OptCntHH_D  ip6OptHH_D             tcpISeqN    tcpPSeqCnt  tcpSeqSntBytes  tcpSeqFaultCnt  tcpPAckCnt  tcpFlwLssAckRcvdBytes  tcpAckFaultCnt  tcpBFlgtMx  tcpInitWinSz  tcpAvgWinSz  tcpMinWinSz  tcpMaxWinSz  tcpWinSzDwnCnt  tcpWinSzUpCnt  tcpWinSzChgDirCnt  tcpWinSzThRt  tcpFlags  tcpAnomaly  tcpJA4T             tcpOptPktCnt  tcpOptCnt  tcpOptions  tcpMSS  tcpWS  tcpMPTBF  tcpMPF  tcpMPAID  tcpMPDSSF  tcpTmS     tcpTmER    tcpEcI  tcpUtm          tcpBtm                tcpSSASAATrip  tcpRTTAckTripMin  tcpRTTAckTripMax  tcpRTTAckTripAvg  tcpRTTAckTripJitAvg  tcpRTTSseqAA  tcpRTTAckJitAvg  tcpStatesAFlags
B     91       0x0400000200004001  1022171701.699480000  1022171726.636773000  24.937293000  1           3        eth:ipv4:tcp  00:00:21:d2:cc:72  00:d0:02:6d:78:00  0x0800           138.212.189.38  jp       "!ASAHI KASEI CORPORATION"  139      138.212.86.201   jp       "AKNWS-NET Asahi Kasei Networks C"  3429     6        23601    12342     0            33731054    42462        6           1460        1429.221    189.2884    0       0.253336  0.001056625   0.003716458  946.4139  1352635   0.313246   0.9974855  0x0011    1           39          64        64        0         0x10   0x5840   0         0x00_0x00000000  0_0            0x00000000_0x00000000  3624816249  23376       34471811        24              23601       42651                  10              10079       33232         33232        33232        33232        0               0              0                  0             0x0098    0x0344      33232_00_00_0       0             0          0x00000000  0       1      0x0000    0x00    0         0x00       0          0          0       0.000000        0.000000000           0              0                 0.110333          0.0002984817      0.001135286          0.002293069   0.00436281       0x03
B     6343     0x0400000200004001  1022171714.045827000  1022171722.457644000  8.411817000   1           3        eth:ipv4:tcp  00:d0:02:6d:78:00  00:10:5a:c5:96:1a  0x0800           139.45.174.202  us       "STRIPE-139-45-174-0-24"    56071    138.212.190.117  jp       "!ASAHI KASEI CORPORATION"          3837     6        10159    5692      6            14821880    0            0           1460        1458.99     32.96766    0       1.465593  0.0008280156  0.01485064   1207.706  1762031   0.2818119  1          0x0411    21426       33832       59        250       1         0x18   0x5844   0         0x00_0x00000000  0_0            0x00000000_0x00000000  1837334633  10104       15000001        0               10159       0                      0               17520       5840          5840         5840         5840         0               0              0                  0             0x03db    0x0200      5840_2-1-1-41460_0  1             4          0x00000016  1460    1      0x0000    0x00    0         0x00       0          0          0       0.000000        0.000000000           0.00025        0                 1.460059          0.0008329496      0.01935957           0.002583705   0.01976381       0x02
B     3609     0x0400000200004001  1022171705.686717000  1022171714.043794000  8.357077000   1           3        eth:ipv4:tcp  00:d0:02:6d:78:00  00:10:5a:c5:96:1a  0x0800           139.45.174.202  us       "STRIPE-139-45-174-0-24"    56070    138.212.190.117  jp       "!ASAHI KASEI CORPORATION"          3820     6        10048    5709      6            14656900    0            0           1460        1458.688    37.40672    0       1.39519   0.0008317156  0.01430882   1202.334  1753831   0.2753697  1          0x0411    10484       44772       59        250       1         0x18   0x5844   0         0x00_0x00000000  0_0            0x00000000_0x00000000  1835183641  9968        15000001        0               10048       0                      0               17520       5840          5840         5840         5840         0               0              0                  0             0x03db    0x0200      5840_2-1-1-41460_0  1             4          0x00000016  1460    1      0x0000    0x00    0         0x00       0          0          0       0.000000        0.000000000           0.000222016    0                 1.389116          0.0007997913      0.01838541           0.002785257   0.01894454       0x02
A     325      0x0400000200004000  1022171701.712093000  1022171726.638722000  24.926629000  1           3        eth:ipv4:tcp  00:d0:02:6d:78:00  00:50:bf:08:44:81  0x0800           19.59.134.250   us       "!Ford Motor Company"       65230    138.212.187.240  jp       "!ASAHI KASEI CORPORATION"          58290    6        9459     5223      0            13696632    0            1448        1448        1448        0           0       0.067445  0.00263523    0.006631293  379.4737  549477.9  0.2885166  1          0x0013    1           387         53        53        0         0x08   0x5844   0         0x00_0x00000000  0_0            0x00000000_0x00000000  2192448358  9268        15002728        44              9459        0                      0               53576       33304         33304        33304        33304        0               0              0                  0             0x00d0    0x0244      33304_00_00_0       9459          28377      0x00000102  0       1      0x0000    0x00    0         0x00       199361062  113909808  0.01    1993610.575439  1020178116.063282670  0              0                 0.04123699        0.001176785       0.001736126          0             0                0x03
If you are unsure about other features of the t2sort function use the -d option:
tawk -d t2sort
t2sort(col, num, type, rev):

  Sort the file according to 'col'.

  Multiple column numbers can be specified by using ';' as separator, e.g., 1 ";" 2.

  To sort in reverse order, use the 't2rsort()' function or set 'rev' to 1.

  If 'num' is omitted or 0, return the full list, otherwise
  the top ('num > 0') or bottom ('num < 0') 'num' results.

  The type of sorting to do (numeric, IP (version) or string) is determined
  based on the first matching record. If the field is empty, then numeric sort
  will be used. The type can be forced by specifying the 'type' parameter as
  follows:
    - "ip" : sorts IP addresses or version (sort -V)
    - "str": sorts strings
    - "num": sorts numbers (sort -g) [default]

  Parameters:
    - col   : column number(s) to use for the sorting
              (use ';' as separator to sort by multiple columns)
    - [num] : return the top/bottom 'num' results
    - [type]: type of sorting to do ('ip', 'str', 'num')
    - [rev] : sort in reverse order

  Dependencies:
    - None

  See also:
    - t2rsort

  Examples:
    - tawk 't2sort(1)' file.txt
    - tawk 't2sort(duration)' file.txt
    - tawk 't2sort(pktsSnt, 5)' file.txt
    - tawk 't2sort(srcIP, 0, "ip")' file.txt
    - tawk 't2sort(dstIP, 0, "ip", 1)' file.txt
    - tawk 't2sort(flowInd ";" pktNo)' file_packets.txt
Spotting connection anomalies with connStat
The best method to spot connection anomalies is to visualize time, connecting IPs and connection counts. The connStat plugin produces the appropriate numbers for this task.
It adds four columns to the flow output:
- connections src IP (
connSip), - connections dst IP (
connDip), - connections between srcIP and dstIP (
connSipDip) - number of unique destination port connections of a certain srcIP (
connSipDprt)
Moreover, an experimental feature connF = connSipDprt / connSip is added which describes the ratio of port connections of a srcIP and the total connection count
of the very srcIP during the lifetime of this flow.
t2build connStat
t2 -r ~/data/annoloc2.pcap -w ~/results... -------------------------------------------------------------------------------- ... connStat: Number of unique source IPs: 3977 (3.98 K) connStat: Number of unique destination IPs: 3210 (3.21 K) connStat: Number of unique source/destination IPs connections: 182 connStat: Max unique number of source IP / destination port connections: 413 connStat: IP connF=connSipDprt/connSip: 0.103847 connStat: IP connG=connSipDprt/connSipDip: 2.269231 connStat: Source IP with max connections: 138.212.189.66 (JP): 366 connections connStat: Destination IP with max connections: 138.212.184.235 (JP): 402 connections connStat: Biggest L3 talker: 138.212.189.38 (JP): 33706 (33.71 K) [2.77%] packets connStat: Biggest L3 talker: 138.212.189.38 (JP): 48279870 (48.28 M) [75.34%] bytes -------------------------------------------------------------------------------- ...
The end report contribution of connStat provides you with connection oriented facts of your traffic. So you should record these numbers at certain dates and times to establish a normal baseline.
If the sending/receiving IPs in your network, exceeds the maximum of your recordings and the unique local addresses exceed the amount of your machines in the network, something is definitely wrong.
Same for the number of receiving IPs and the ratio of src and dst IPs. The 5th line
consists of experimental numbers which served well in finding malware, so if the
prtcon/sdcon and prtcon/scon are >> 1 you should look a bit closer at this traffic.
I’ll try to elaborate more on that matter in a more specialized plugin.
The biggest connection initiator or connector and the biggest endpoint connector at the end of the connStat report gives you an indication where to look first, when inspecting a flow file. So it is located in japan.
An example tawk command is shown below extracting only the initiation flows from the biggest connection initiator printing only
connection relevant features (the not command is used instead of ! to prevent tawk from filtering out the header (note that the hdr() function could also have been used)).
tawk 'not(bitsanyset($flowStat, 1)) && shost("138.212.189.66") { print $timeFirst, $timeLast, $srcIP, $srcIPCC, $connSip, $connSipDip, connSipDprt, $connF }\' ~/results/annoloc2_flows.txt | LC_ALL=C sort -t$'\t' -n -k3,3 | head -n 25 | tcol
1022171701.715552000  1022171701.715552000  138.212.189.66  jp  368  2  26  1.122283
1022171701.748593000  1022171701.748593000  138.212.189.66  jp  367  1  26  0.002724796
1022171701.834407000  1022171701.834407000  138.212.189.66  jp  366  2  26  1.122951
1022171701.845499000  1022171701.845499000  138.212.189.66  jp  365  2  26  1.120548
1022171701.847853000  1022171701.847853000  138.212.189.66  jp  364  1  26  0.002747253
1022171701.868853000  1022171701.868853000  138.212.189.66  jp  363  1  26  1.121212
1022171701.878890000  1022171701.878890000  138.212.189.66  jp  362  2  26  1.121547
1022171701.922395000  1022171701.922395000  138.212.189.66  jp  361  2  26  1.119114
1022171701.960091000  1022171701.960091000  138.212.189.66  jp  360  1  26  1.116667
1022171702.089215000  1022171702.089215000  138.212.189.66  jp  359  2  26  1.116992
1022171702.188444000  1022171702.188444000  138.212.189.66  jp  358  2  26  1.114525
1022171702.299047000  1022171702.299047000  138.212.189.66  jp  357  2  26  1.112045
1022171702.433671000  1022171702.433671000  138.212.189.66  jp  356  2  26  1.109551
1022171702.500338000  1022171702.500338000  138.212.189.66  jp  355  1  26  1.107042
1022171702.715098000  1022171702.715098000  138.212.189.66  jp  354  1  26  1.107345
1022171702.715682000  1022171702.715682000  138.212.189.66  jp  353  1  26  1.107649
1022171702.959477000  1022171702.959477000  138.212.189.66  jp  352  2  26  1.107955
1022171702.971824000  1022171702.971824000  138.212.189.66  jp  351  2  26  0.005698006
1022171703.112264000  1022171703.112264000  138.212.189.66  jp  350  2  26  1.108571
1022171703.269574000  1022171703.269574000  138.212.189.66  jp  349  2  26  1.106017
1022171703.270083000  1022171703.270083000  138.212.189.66  jp  348  2  26  1.103448
1022171703.364251000  1022171703.364251000  138.212.189.66  jp  347  1  26  1.100865
1022171703.474555000  1022171703.474555000  138.212.189.66  jp  346  1  26  1.101156
1022171703.496314000  1022171703.496314000  138.212.189.66  jp  345  2  26  1.101449
1022171703.566841000  1022171703.566841000  138.212.189.66  jp  344  2  26  1.098837
Don’t be shocked by the length of the command, tawk will become natural if you use it more often in
other tutorials.
Up until now, we have used absolute time stamps. For static plots, the relative time to the beginning of the pcap is easier to grasp. So first move to the tranalyzer2` folder and open the file src/tranalyzer.h*
tranalyzer2
vi src/tranalyzer.h
There you will see a lot of stuff to configure, this is a lot of fun for later.
We look for RELTIME. Change it to 1 as shown below
...
// Time mode
#define RELTIME 1 // 0: Absolute time, 1: Relative internal time
...
Use the t2conf command below and recompile all plugins used so far, because certain plugins such as basicFlow
are also depending on the core configuration. And rerun t2.
t2conf tranalyzer2 -D RELTIME=1 && t2build -R
t2 -r ~/data/annoloc2.pcap -w ~/results
For visualization, we only need to extract the said three connStat features and pipe it into t2plot to create a nice 3D graphics in logarithmic scale
of the z-axis.
tawk 'ipv4() && $connSip { print $timeFirst, $srcIP, $connSip }' ~/results/annoloc2_flows.txt | t2plot -t "Simple connStat anomaly graph" -sx 0:25 -sy 0:2800000000 -v 60,75 -lz
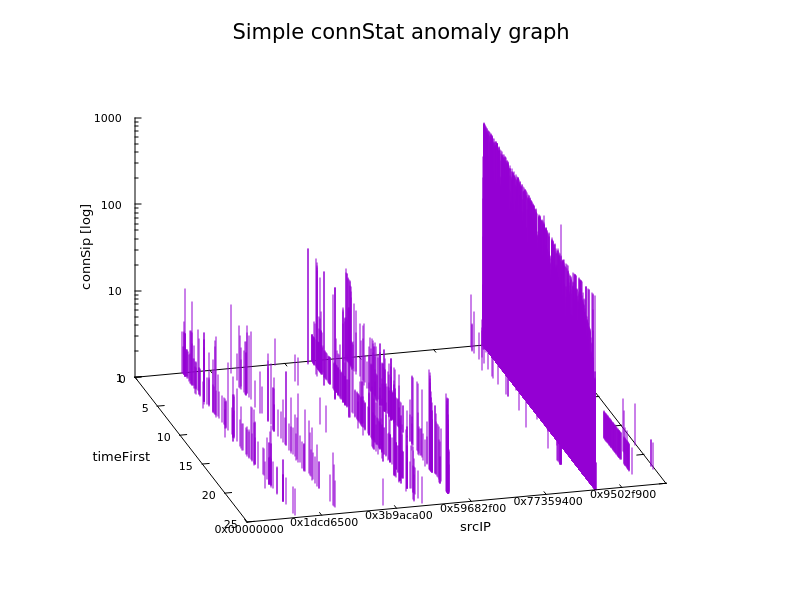
You can now instantly identify the time based evolution of all IP addresses and spot the biggest connecter, get the
count range and select him with a simple if clause in a tawk script.
The IP addresses are converted to hex by t2plot.
The -r 1 option re-plots the graph every second, so that you can turn it using your mouse.
If you use the gpq3x script you can produce an online waterfall plot with the same characteristics. Together with
t2 rrd monitoring you then have an efficient online graphical anomaly detection.
Looks also good on the wall if customers pop in.
Timeline flow analysis
Often, typical patterns emerge from the time based flow production. So if an IP stands out in the connStat end report,
a flow connection diagram can be useful. Just extract the biggest connector from above 138.212.189.66, store
the extracted flows in a new file and run the t2timeline script as indicated below.
tawk 'host("138.212.189.66")' ~/results/annoloc2_flows.txt > ~/results/annoloc2_ip.txt
t2timeline -r -ws 700,400 ~/results/annoloc2_ip.txt
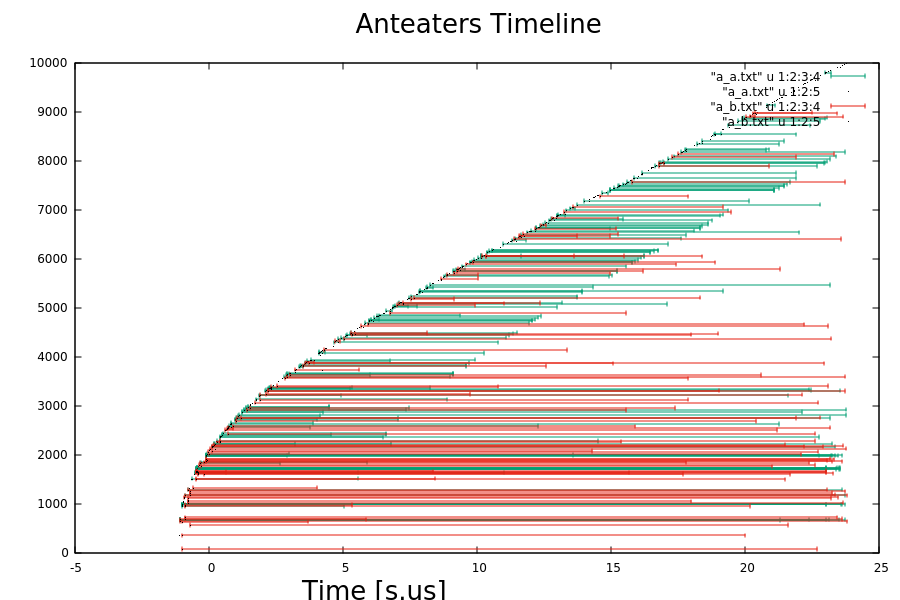
The greens are requesting flows while the reds are response flows. The z-axis denotes the flow index (flowInd).
If you point the mouse on the beginning of a flow several flow parameters are displayed helping you to identify flows.
Maybe there are still too many flows to see something, but you could now select certain protocols, such as
TCP or ports, such as port 80. Write a short tawk and rerun the t2timeline script yourself.
Moreover, the timeline graph is very useful to assess the creation of training data for AI. For example, if you have a two class problem, the timelines of all pcaps of the two classes should look similar, if and only if the requirement is that the flows are created by the same equipment and relative timing, certain encrypted content classification task. Then these requirements to produce a reasonable classifier. If the timeline plots differ drastically, you caught somebody producing garbage training data or cheating.
Note, that your classifier will always find features, which might not correlate with the problem at hand. So watch your six!
And don’t forget to reset RELTIME to 0 as the following paragraphs depend on
on absolute time representation in the flow file.
t2conf tranalyzer2 -D RELTIME=0 && t2build -R
Global statistical plugins
After inspecting the T2 end report, we have a good overview about the pcap state, certain abnormalities and statistics. As each network has its specific protocol statistics, T2 provides several global plugins which produce specific protocols statistics.
protoStat and icmpDecode are to be inspected after the end report. The plugin generates the file annoloc2_protocols.txt which is sorted according to Layer 2-4 protocol numbers.
I unloaded plugins not needed here to reduce the amount of confusing output and loaded icmpDecode and protoStat.
t2build -u tcpStates tcpFlags connStat basicStats
t2build icmpDecode protoStats
t2 -r ~/data/annoloc2.pcap -w ~/results================================================================================ Tranalyzer 0.9.4 (Anteater), Cobra. PID: 85762, Prio: 0, SID: 666 ================================================================================ Date: 1751559556.000084411 sec (Thu 03 Jul 2025 18:19:16 CEST) [INF] Creating flows for L2, IPv4, IPv6 Active plugins: 01: protoStats, 0.9.4 02: basicFlow, 0.9.4 03: icmpDecode, 0.9.4 04: txtSink, 0.9.4 [INF] IPv4 Ver: 6, Rev: 02072025, Range Mode: 0, subnet ranges loaded: 7237805 (7.24 M) [INF] IPv6 Ver: 6, Rev: 02072025, Range Mode: 0, subnet ranges loaded: 1419258 (1.42 M) Processing file: /home/user/data/annoloc2.pcap Link layer type: Ethernet [EN10MB/1] Snapshot length: 66 Dump start: 1022171701.691172000 sec (Thu 23 May 2002 16:35:01 GMT) [WRN] snapL2Length: 54 - snapL3Length: 40 - IP length in header: 1500 Dump stop : 1022171726.640398000 sec (Thu 23 May 2002 16:35:26 GMT) Total dump duration: 24.949226000 sec Finished processing. Elapsed time: 0.433439031 sec Finished unloading flow memory. Time: 0.581555921 sec Percentage completed: 100.00% Number of processed packets: 1219015 (1.22 M) Number of processed bytes: 64082726 (64.08 M) Number of raw bytes: 844642686 (844.64 M) Number of pad bytes: 1758405 (1.76 M) Number of pcap bytes: 83586990 (83.59 M) Number of L2 packets: 247 [0.02%] Number of IPv4 packets: 1218588 (1.22 M) [99.96%] Number of IPv6 packets: 180 [0.01%] Number of A packets: 561587 (561.59 K) [46.07%] Number of B packets: 657428 (657.43 K) [53.93%] Number of A bytes: 29273850 (29.27 M) [45.68%] Number of B bytes: 34808876 (34.81 M) [54.32%] <A packet load>: 52.13 <B packet load>: 52.95 -------------------------------------------------------------------------------- icmpDecode: Aggregated icmpStat=0x21 icmpDecode: Number of ICMP echo request packets: 224 [7.32%] icmpDecode: Number of ICMP echo reply packets: 191 [6.24%] icmpDecode: ICMP echo reply / request ratio: 0.85 -------------------------------------------------------------------------------- Headers count: min: 2, max: 5, avg: 3.01 Number of ARP packets: 247 [0.02%] Number of GRE packets: 20 [0.00%] Number of IGMP packets: 12 [0.00%] Number of ICMP packets: 3059 (3.06 K) [0.25%] Number of ICMPv6 packets: 11 [0.00%] Number of TCP packets: 948743 (948.74 K) [77.83%] Number of TCP bytes: 52643546 (52.64 M) [82.15%] Number of UDP packets: 266900 (266.90 K) [21.89%] Number of UDP bytes: 11234272 (11.23 M) [17.53%] Number of IPv4 fragmented packets: 2284 (2.28 K) [0.19%] ~~~~~~~~~~~~~~~~~~~~~~~~~~~~~~~~~~~~~~~~~~~~~~~~~~~~~~~~~~~~~~~~~~~~~~~~~~~~~~~~ Number of processed flows: 17098 (17.10 K) Number of processed L2 flows: 99 [0.58%] Number of processed IPv4 flows: 16937 (16.94 K) [99.06%] Number of processed IPv6 flows: 62 [0.36%] Number of processed A flows: 9718 (9.72 K) [56.84%] Number of processed B flows: 7380 (7.38 K) [43.16%] Number of request flows: 9194 (9.19 K) [53.77%] Number of reply flows: 7904 (7.90 K) [46.23%] Total A/B flow asymmetry: 0.14 Total req/rply flow asymmetry: 0.08 Number of processed A+B packets/A+B flows: 71.30 Number of processed A packets/A flows: 57.79 Number of processed B packets/ B flows: 89.08 Number of processed total packets/s: 48859.83 (48.86 K) Number of processed A+B packets/s: 48859.83 (48.86 K) Number of processed A packets/s: 22509.20 (22.51 K) Number of processed B packets/s: 26350.64 (26.35 K) ~~~~~~~~~~~~~~~~~~~~~~~~~~~~~~~~~~~~~~~~~~~~~~~~~~~~~~~~~~~~~~~~~~~~~~~~~~~~~~~~ <Number of processed flows/s>: 685.31 <Bandwidth>: 270268555 b/s (270.27 Mb/s) <Snapped bandwidth>: 20548205 b/s (20.55 Mb/s) <Raw bandwidth>: 270835716 b/s (270.84 Mb/s) Max number of flows in memory: 17098 (17.10 K) [6.52%] Memory usage: 0.12 GB [0.17%] Aggregated flowStat=0x0c0018fa0222d044 [WRN] L3 SnapLength < Length in IP header [WRN] L4 header snapped [WRN] Consecutive duplicate IP ID [WRN] IPv4/6 fragmentation header packet missing [WRN] IPv4/6 packet fragmentation sequence not finished [INF] Stop dissecting: Clipped packet, unhandled protocol or subsequent fragment [INF] Layer 2 flows [INF] IPv4 flows [INF] IPv6 flows [INF] ARP [INF] IPv4/6 fragmentation [INF] IPv4/6 in IPv4/6 [INF] GRE encapsulation [INF] GTP tunnel [INF] SSDP/UPnP
As you can see icmpDecode produces the important measure of reply / request ratio, for a rapid assessment of malicious activity, also the relative amount of request and reply packets are a valuable indication. Moreover it indicates the presents of potential covert channels.
icmpStat from the icmpDecode plugin reports something, let’s look into that:
The icmpStat column is to be interpreted as follows:

   bit | icmpStat | Description
   =============================================================================
     0 | 0x01     | Flow is ICMP
     1 | 0x02     | -
     2 | 0x04     | -
     3 | 0x08     | -

     4 | 0x10     | WANG2 Microsoft bandwidth test
     5 | 0x20     | ICMP Echo seq num abnormal increment
     6 | 0x40     | Embedded LOKI covert channel
     7 | 0x80     | Embedded SSH covert channel
0x20 denotes a ping with the sequence numbers not incremental as usual. Hmmm, suspicious?
Is that real?
Homework:
Write a tawk script which selects all flows where bit 5 is set. And maybe you should also look at the packet file.
Let’s move on to a global statistical view. The plugin protoStat provides exactly this in the protocols file.
tcol ~/results/annoloc2_protocols.txt
# Total packets: 1219015 (1.22 M)
# Total bytes: 64082726 (64.08 M)
# L2/3 Protocol                          Packets                               Bytes      Description
0x0800                         1218588 [ 99.96%]                  64061156 [ 99.97%]      Internet Protocol version 4 (IPv4)
0x0806                             247 [  0.02%]                     10374 [  0.02%]      Address Resolution Protocol (ARP)
0x86dd                             180 [  0.01%]                     11196 [  0.02%]      Internet Protocol version 6 (IPv6)


# Total IPv4 packets: 1218588 (1.22 M) [99.96%]
# Total IPv6 packets: 180 [0.01%]
# L4 Protocol                            Packets                               Bytes      Description
  1                               3059 [  0.25%]                    191934 [  0.30%]      Internet Control Message Protocol (ICMP)
  2                                 12 [  0.00%]                       456 [  0.00%]      Internet Group Management Protocol (IGMP)
  6                             948743 [ 77.83%]                  52643546 [ 82.15%]      Transmission Control Protocol (TCP)
 17                             266900 [ 21.89%]                  11234272 [ 17.53%]      User Datagram Protocol (UDP)
 22                                  1 [  0.00%]                        34 [  0.00%]      XEROX NS IDP
 23                                  1 [  0.00%]                        34 [  0.00%]      Trunk-1
 28                                  1 [  0.00%]                        34 [  0.00%]      Internet Reliable Transaction
 47                                 20 [  0.00%]                       680 [  0.00%]      General Routing Encapsulation
 48                                  1 [  0.00%]                        34 [  0.00%]      Mobile Host Routing Protocol
 58                                 11 [  0.00%]                       682 [  0.00%]      Internet Control Message Protocol for IPv6 (ICMPv6)
 59                                  1 [  0.00%]                        34 [  0.00%]      No Next Header for IPv6
 64                                  1 [  0.00%]                        34 [  0.00%]      SATNET and Backroom EXPAK
 79                                  1 [  0.00%]                        34 [  0.00%]      WIDEBAND EXPAK
 83                                  1 [  0.00%]                        34 [  0.00%]      Virtual Integrated NEtwork Service
 95                                  1 [  0.00%]                        34 [  0.00%]      Mobile Internetworking Control Pro.
103                                  3 [  0.00%]                       102 [  0.00%]      Protocol Independent Multicast
112                                  1 [  0.00%]                        34 [  0.00%]      Virtual Router Redundancy Protocol
114                                  1 [  0.00%]                        34 [  0.00%]      0-hop protocol
126                                  1 [  0.00%]                        34 [  0.00%]      Combat Radio Transport Protocol
131                                  1 [  0.00%]                        34 [  0.00%]      Private IP Encapsulation within IP
133                                  1 [  0.00%]                        34 [  0.00%]      Fibre Channel
147                                  1 [  0.00%]                        34 [  0.00%]      -
168                                  1 [  0.00%]                        34 [  0.00%]      -
223                                  1 [  0.00%]                        34 [  0.00%]      -
228                                  1 [  0.00%]                        34 [  0.00%]      -
229                                  1 [  0.00%]                        34 [  0.00%]      -
231                                  1 [  0.00%]                        34 [  0.00%]      -


# Total TCP packets: 948743 (948.74 K) [77.83%]
# Total TCP bytes: 52643546 (52.64 M) [82.15%]
# TCP Port                               Packets                               Bytes      Description
   13                                2 [  0.00%]                       108 [  0.00%]      Daytime (RFC 867)
   20                           120418 [ 12.69%]                   6703628 [ 12.73%]      File Transfer [Default Data]
   21                             2082 [  0.22%]                    113512 [  0.22%]      File Transfer [Control]
   22                             3793 [  0.40%]                    213006 [  0.40%]      The Secure Shell (SSH) Protocol
   23                              309 [  0.03%]                     16686 [  0.03%]      Telnet
   25                              134 [  0.01%]                      8676 [  0.02%]      Simple Mail Transfer Protocol (SMTP)
   49                              175 [  0.02%]                      9558 [  0.02%]      Login Host Protocol (TACACS)
   53                                8 [  0.00%]                       528 [  0.00%]      Domain Name Server (DNS)
   65                               13 [  0.00%]                       742 [  0.00%]      TACACS-Database Service
   66                                8 [  0.00%]                       448 [  0.00%]      Oracle SQL*NET
   67                                8 [  0.00%]                       448 [  0.00%]      Bootstrap Protocol Server
   68                                6 [  0.00%]                       324 [  0.00%]      Bootstrap Protocol Client
   80                            73283 [  7.72%]                   4037878 [  7.67%]      World Wide Web HTTP
   81                            10937 [  1.15%]                    609542 [  1.16%]      Cobalt cube web access or trojan
   83                               47 [  0.00%]                      2538 [  0.00%]      MIT ML Device
  110                             1493 [  0.16%]                     83254 [  0.16%]      Post Office Protocol (POP) - Version 3
...


# Total UDP packets: 266900 (266.90 K) [21.89%]
# Total UDP bytes: 11234272 (11.23 M) [17.53%]
# UDP Port                               Packets                               Bytes      Description
    0                               67 [  0.03%]                      2278 [  0.02%]
   37                              321 [  0.12%]                     13482 [  0.12%]      Time
   53                             2928 [  1.10%]                    158112 [  1.41%]      Domain Name Server (DNS)
   67                               14 [  0.01%]                       588 [  0.01%]      Bootstrap Protocol Server
  123                               34 [  0.01%]                      1428 [  0.01%]      Network Time Protocol
  137                              503 [  0.19%]                     21126 [  0.19%]      NETBIOS Name Service
  138                              152 [  0.06%]                      6384 [  0.06%]      NETBIOS Datagram Service
  161                              212 [  0.08%]                      8904 [  0.08%]      SNMP
  412                                7 [  0.00%]                       294 [  0.00%]      Trap Convention Port
  427                                3 [  0.00%]                       126 [  0.00%]      Server Location
  513                                3 [  0.00%]                       126 [  0.00%]      maintains data bases showing who is
  655                             1522 [  0.57%]                     59916 [  0.53%]      TINC
 1022                                2 [  0.00%]                        84 [  0.00%]      RFC3692-style Experiment 2 (*) [RFC4727]
 1025                             1214 [  0.45%]                     50988 [  0.45%]      network blackjack
 1026                                2 [  0.00%]                        84 [  0.00%]      Calendar Access Protocol
...
Here as well the biggest protocol talker is interesting to begin an analysis.
The script protStat sorts the protocols file according to number of packets or bytes.
The -p option defines the lower limit of probability to display. We selected 1%
and added the UDP-Lite and SCTP protocols:
t2conf protoStats -D UDPLITE_STAT=1 -D SCTP_STAT=1 && t2build protoStats
t2 -r ~/data/annoloc2.pcap -w ~/results
protStat -p=1 ~/results/annoloc2_protocols.txt
L2/3 Protocol	                       Packets	                         Bytes	Description
0x0800	                       1218588 [ 99.96%]	                      64061156 [ 99.97%]	Internet Protocol version 4 (IPv4)

L4 Protocol	                       Packets	                         Bytes	Description
  6	                        948743 [ 77.83%]	                      52643546 [ 82.15%]	Transmission Control Protocol (TCP)
 17	                        266900 [ 21.89%]	                      11234272 [ 17.53%]	User Datagram Protocol (UDP)

TCP Port	                       Packets	                         Bytes	Description
  139	                        203627 [ 21.46%]	                      11051370 [ 20.99%]	NETBIOS Session Service
   20	                        120418 [ 12.69%]	                       6703628 [ 12.73%]	File Transfer [Default Data]
   80	                         73283 [  7.72%]	                       4037878 [  7.67%]	World Wide Web HTTP
  445	                         27611 [  2.91%]	                       1495334 [  2.84%]	Microsoft-DS
 4662	                         26586 [  2.80%]	                       1484248 [  2.82%]	OrbitNet Message Service
 1214	                         20702 [  2.18%]	                       1134572 [  2.16%]	KAZAA
56071	                         15851 [  1.67%]	                        855970 [  1.63%]
56070	                         15757 [  1.66%]	                        850894 [  1.62%]
58290	                         14682 [  1.55%]	                        969012 [  1.84%]
 6699	                         13711 [  1.45%]	                        757674 [  1.44%]
   81	                         10937 [  1.15%]	                        609542 [  1.16%]	Cobalt cube web access or trojan

UDP Port	                       Packets	                         Bytes	Description
27005	                         34284 [ 12.85%]	                       1439928 [ 12.82%]	FLEX LM (1-10)
27960	                         24798 [  9.29%]	                       1041516 [  9.27%]
 7777	                         15241 [  5.71%]	                        640122 [  5.70%]	cbt
28920	                         14301 [  5.36%]	                        600642 [  5.35%]
10007	                         11847 [  4.44%]	                        497574 [  4.43%]	MVS Capacity
27115	                         11220 [  4.20%]	                        471240 [  4.19%]
12203	                         10654 [  3.99%]	                        447468 [  3.98%]
27963	                          8591 [  3.22%]	                        360822 [  3.21%]
28015	                          8458 [  3.17%]	                        355236 [  3.16%]
27016	                          7948 [  2.98%]	                        333816 [  2.97%]
27116	                          7508 [  2.81%]	                        315336 [  2.81%]
27025	                          7347 [  2.75%]	                        308574 [  2.75%]
 1111	                          7312 [  2.74%]	                        307104 [  2.73%]	LM Social Server
28910	                          6865 [  2.57%]	                        288330 [  2.57%]
27035	                          6511 [  2.44%]	                        273462 [  2.43%]
27961	                          4869 [  1.82%]	                        204498 [  1.82%]
 7000	                          3879 [  1.45%]	                        162918 [  1.45%]	file server itself
28901	                          3619 [  1.36%]	                        151998 [  1.35%]
 1028	                          3570 [  1.34%]	                        149940 [  1.33%]
62626	                          3364 [  1.26%]	                        141288 [  1.26%]
61996	                          3324 [  1.25%]	                        139608 [  1.24%]
28001	                          2984 [  1.12%]	                        125328 [  1.12%]
   53	                          2928 [  1.10%]	                        158112 [  1.41%]	Domain Name Server (DNS)
So no UDP-Lite or SCTP packets.
We have 0.25% ICMP traffic, which is not abnormal for that type of traffic. It is not listed above, because we only wanted to cut of a 1%.
Often it is necessary to look at the ICMP messages in detail because some may indicate problems or even malicious behavior. For that icmpDecode provides a detailed statistical overview:
cat ~/results/annoloc2_icmpStats.txt
Total number of ICMP packets: 3070 (3.07 K) [0.25%]

Number of ICMP packets: 3059 (3.06 K) [0.25%]
Number of ICMPv6 packets: 11 [0.00%]

ICMP echo reply / request ratio: 0.853

# ICMP Type           Code                               Packets
ICMP_ECHOREQUEST      -                                      224 [  7.32%]
ICMP_ECHOREPLY        -                                      191 [  6.24%]
ICMP_DEST_UNREACH     ICMP_HOST_UNREACH                       25 [  0.82%]
ICMP_DEST_UNREACH     ICMP_PORT_UNREACH                     2603 [ 85.09%]
ICMP_TIME_EXCEEDED    ICMP_EXC_TTL                            14 [  0.46%]
ICMP_TIME_EXCEEDED    ICMP_EXC_FRAGTIME                        2 [  0.07%]

# ICMPv6 Type         Code                               Packets
ICMP6_RTER_ADVERT     -                                        5 [ 45.45%]
ICMP6_NBOR_SOLICIT    -                                        3 [ 27.27%]
ICMP6_NBOR_ADVERT     -                                        3 [ 27.27%]
So many ICMP_DEST_UNREACH, hmmm. Is that malicious?
Now let’s find all hosts sending ICMP messages:
tawk 'icmp()' ~/results/annoloc2_flows.txt | tcol
%dir  flowInd  flowStat            timeFirst             timeLast              duration      numHdrDesc  numHdrs  hdrDesc        srcMac             dstMac             ethType  vlanID  srcIP            srcIPCC  srcIPOrg                            srcPort  dstIP            dstIPCC  dstIPOrg                            dstPort  l4Proto  icmpStat  icmpTCcnt  icmpBFTypH_TypL_Code          icmpTmGtw   icmpEchoSuccRatio  icmpPFindex
A     59       0x0400000200004001  1022171701.692762000  1022171701.692762000  0.000000000   1           3        eth:ipv4:icmp  00:80:48:b3:22:ef  00:d0:02:6d:78:00  0x0800           138.212.187.10   jp       "!ASAHI KASEI CORPORATION"          0        201.116.148.149  mx       "Gestión de direccionamiento Uni"   0        1        0x01      1          0x00000000_0x00000008_0x0008  0x00000000  0                  59
A     893      0x0400000200004001  1022171701.812425000  1022171701.812425000  0.000000000   1           3        eth:ipv4:icmp  00:80:48:d7:ed:7a  00:d0:02:6d:78:00  0x0800           138.212.189.88   jp       "!ASAHI KASEI CORPORATION"          0        201.116.161.83   mx       "UNINET"                            0        1        0x01      1          0x00000000_0x00000008_0x0008  0x00000000  0                  893
A     1069     0x0400000200004001  1022171701.889357000  1022171701.889357000  0.000000000   1           3        eth:ipv4:icmp  00:48:54:7a:04:0f  00:d0:02:6d:78:00  0x0800           138.212.184.71   jp       "!ASAHI KASEI CORPORATION"          0        146.208.9.41     us       "!Keysight Technologies"            0        1        0x01      1          0x00000000_0x00000008_0x0008  0x00000000  0                  1069
A     1177     0x0400000200004001  1022171701.956543000  1022171701.956543000  0.000000000   1           3        eth:ipv4:icmp  00:d0:02:6d:78:00  00:80:48:b3:22:c4  0x0800           201.118.86.105   mx       "!Gestión de direccionamiento Un"   0        138.212.189.66   jp       "!ASAHI KASEI CORPORATION"          0        1        0x01      1          0x00000000_0x00000008_0x0002  0x00000000  0                  1177
A     1204     0x0400000200004001  1022171701.980834000  1022171701.980834000  0.000000000   1           3        eth:ipv4:icmp  00:d0:02:6d:78:00  00:80:48:b3:22:c4  0x0800           138.213.40.91    gb       "UK-MICROSOFT-19900530"             0        138.212.189.66   jp       "!ASAHI KASEI CORPORATION"          0        1        0x01      1          0x00000000_0x00000008_0x0008  0x00000000  0                  1204
...
By scrolling to the right you see the icmpBFTypH_TypL_Code bit field. The part icmpBFTypH_TypL denotes the ICMP type also for IPv6 which needs more bit positions. The code part denotes the
corresponding code. Note that the bit field coding is according to log2, hence the bit position denotes the value. You can decode all coding by asking tawk.
The icmpBFType_Code column is to be interpreted as follows:

   bit | icmpBFType  | bit | icmpBFCode | Description
   =============================================================================
     0 | 0x0000 0001 |     |            | Echo Reply

     3 | 0x0000 0008 |     |            | Destination Unreachable
       |             |   0 | 0x0001     |         Network Unreachable
       |             |   1 | 0x0002     |         Host Unreachable
       |             |   2 | 0x0004     |         Protocol Unreachable
       |             |   3 | 0x0008     |         Port Unreachable
       |             |   4 | 0x0010     |         Fragmentation Needed/DF set
       |             |   5 | 0x0020     |         Source Route failed
       |             |   6 | 0x0040     |         Dest net unknown
       |             |   7 | 0x0080     |         Dest host unknown
       |             |   8 | 0x0100     |         Src host isolated
       |             |   9 | 0x0200     |         Dest net administratively prohibited
       |             |  10 | 0x0400     |         Dest host administratively prohibited
       |             |  11 | 0x0800     |         Dest net unreachable for type of service
       |             |  12 | 0x1000     |         Dest host unreachable for type of service
       |             |  13 | 0x2000     |         Communication administratively prohibited
       |             |  14 | 0x4000     |         Precedence violation
       |             |  15 | 0x8000     |         Precedence cut off

     4 | 0x0000 0010 |     |            | Source Quench

     5 | 0x0000 0020 |     |            | Redirect (change route)
       |             |   0 | 0x0001     |         Redirect Net
       |             |   1 | 0x0002     |         Redirect Host
       |             |   2 | 0x0004     |         Redirect Net for TOS
       |             |   3 | 0x0008     |         Redirect Host for TOS

     6 | 0x0000 0040 |     |            | Alternate Host Address
       |             |   0 | 0x0001     |         Alternate Address for Host

     8 | 0x0000 0100 |     |            | Echo Request

     9 | 0x0000 0200 |     |            | Router advertisement
       |             |   0 | 0x0001     |
       |             |  16 | 0x0000     | Does not route common traffic

    10 | 0x0000 0400 |     |            | Router selection

    11 | 0x0000 0800 |     |            | Time Exceeded
       |             |   0 | 0x0001     |         TTL count exceeded
       |             |   1 | 0x0002     |         Fragment Reassembly time exceeded

    12 | 0x0000 1000 |     |            | Parameter Problem
    13 | 0x0000 2000 |     |            | Timestamp Request
    14 | 0x0000 4000 |     |            | Timestamp Reply
    15 | 0x0000 8000 |     |            | Information Request

    16 | 0x0001 0000 |     |            | Information Reply
    17 | 0x0002 0000 |     |            | Address Mask Request
    18 | 0x0004 0000 |     |            | Address Mask Reply

    30 | 0x4000 0000 |     |            | Traceroute
    39 | 0x0000 0080 |     |            | SKIP

    40 | 0x0000 0100 |     |            | Photuris (Session Key Management)
       |             |   0 | 0x0001     |         Bad SPI
       |             |   1 | 0x0002     |         Authentication failed
       |             |   2 | 0x0004     |         Decompression failed
       |             |   3 | 0x0008     |         Decryption failed
       |             |   4 | 0x0010     |         Need authentication
       |             |   5 | 0x0020     |         Need authorization

    41 | 0x0000 0200 |     |            | Seamoby
    42 | 0x0000 0400 |     |            | Extended Echo Request
    43 | 0x0000 0800 |     |            | Extended Echo Reply
The overflow in the typy field will be fixed either with a 64 bit field or by a reconcilation between IPv4/6. Hang on.
Let us extract all ICMP_HOST_UNREACH and ICMP_PORT_UNREACH, code 3. So the 3rd parameter should be 23=0x0008.
tawk '{ split($icmpBFTypH_TypL_Code, A, "_"); if (bitsanyset(A[3], 0x8)) print }' ~/results/annoloc2_flows.txt | head -n 15 | tcol
dir  flowInd  flowStat            timeFirst             timeLast              duration     numHdrDesc  numHdrs  hdrDesc        srcMac             dstMac             ethType  vlanID  srcIP           srcIPCC  srcIPOrg                           srcPort  dstIP            dstIPCC  dstIPOrg                            dstPort  l4Proto  icmpStat  icmpTCcnt  icmpBFTypH_TypL_Code          icmpTmGtw   icmpEchoSuccRatio  icmpPFindex
A     59       0x0400000200004001  1022171701.692762000  1022171701.692762000  0.000000000  1           3        eth:ipv4:icmp  00:80:48:b3:22:ef  00:d0:02:6d:78:00  0x0800           138.212.187.10  jp       "!ASAHI KASEI CORPORATION"         0        201.116.148.149  mx       "Gestión de direccionamiento Uni"   0        1        0x01      1          0x00000000_0x00000008_0x0008  0x00000000  0                  59
A     893      0x0400000200004001  1022171701.812425000  1022171701.812425000  0.000000000  1           3        eth:ipv4:icmp  00:80:48:d7:ed:7a  00:d0:02:6d:78:00  0x0800           138.212.189.88  jp       "!ASAHI KASEI CORPORATION"         0        201.116.161.83   mx       "UNINET"                            0        1        0x01      1          0x00000000_0x00000008_0x0008  0x00000000  0                  893
A     1069     0x0400000200004001  1022171701.889357000  1022171701.889357000  0.000000000  1           3        eth:ipv4:icmp  00:48:54:7a:04:0f  00:d0:02:6d:78:00  0x0800           138.212.184.71  jp       "!ASAHI KASEI CORPORATION"         0        146.208.9.41     us       "!Keysight Technologies"            0        1        0x01      1          0x00000000_0x00000008_0x0008  0x00000000  0                  1069
A     1204     0x0400000200004001  1022171701.980834000  1022171701.980834000  0.000000000  1           3        eth:ipv4:icmp  00:d0:02:6d:78:00  00:80:48:b3:22:c4  0x0800           138.213.40.91   gb       "UK-MICROSOFT-19900530"            0        138.212.189.66   jp       "!ASAHI KASEI CORPORATION"          0        1        0x01      1          0x00000000_0x00000008_0x0008  0x00000000  0                  1204
A     1232     0x0400000200004001  1022171702.009674000  1022171702.009674000  0.000000000  1           3        eth:ipv4:icmp  00:48:54:7a:04:0f  00:d0:02:6d:78:00  0x0800           138.212.184.71  jp       "!ASAHI KASEI CORPORATION"         0        36.237.77.156    tw       "Chunghwa Telecom Co,Ltd HINET-NE"  0        1        0x01      1          0x00000000_0x00000008_0x0008  0x00000000  0                  1232
A     1557     0x0400000200004001  1022171702.247453000  1022171702.247453000  0.000000000  1           3        eth:ipv4:icmp  00:04:76:22:07:90  00:d0:02:6d:78:00  0x0800           138.212.186.88  jp       "!ASAHI KASEI CORPORATION"         0        201.19.77.72     br       "V tal"                             0        1        0x01      1          0x00000000_0x00000008_0x0008  0x00000000  0                  1557
A     1572     0x0400000200004001  1022171702.265015000  1022171702.265015000  0.000000000  1           3        eth:ipv4:icmp  00:08:a1:1d:3f:f1  00:d0:02:6d:78:00  0x0800           138.212.191.25  jp       "!ASAHI KASEI CORPORATION"         0        19.50.144.156    us       "!Ford Motor Company"               0        1        0x01      1          0x00000000_0x00000008_0x0008  0x00000000  0                  1572
A     1717     0x0400000200004001  1022171702.396273000  1022171702.396273000  0.000000000  1           3        eth:ipv4:icmp  00:80:48:b3:24:eb  00:d0:02:6d:78:00  0x0800           138.212.190.25  jp       "!ASAHI KASEI CORPORATION"         0        19.6.20.159      us       "!Ford Motor Company"               0        1        0x01      1          0x00000000_0x00000008_0x0008  0x00000000  0                  1717
A     1740     0x0400000200004001  1022171702.417049000  1022171702.417049000  0.000000000  1           3        eth:ipv4:icmp  00:80:48:b3:22:ef  00:d0:02:6d:78:00  0x0800           138.212.187.10  jp       "!ASAHI KASEI CORPORATION"         0        65.171.40.80     us       "COGENT-174"                        0        1        0x01      1          0x00000000_0x00000008_0x0008  0x00000000  0                  1740
A     1749     0x0400000200004001  1022171702.423157000  1022171702.423157000  0.000000000  1           3        eth:ipv4:icmp  00:80:48:b3:22:ef  00:d0:02:6d:78:00  0x0800           138.212.187.10  jp       "!ASAHI KASEI CORPORATION"         0        193.108.29.243   lv       "LV-LMT"                            0        1        0x01      1          0x00000000_0x00000008_0x0008  0x00000000  0                  1749
A     1819     0x0400000200004001  1022171702.510250000  1022171702.510250000  0.000000000  1           3        eth:ipv4:icmp  00:80:48:b3:22:ef  00:d0:02:6d:78:00  0x0800           138.212.187.10  jp       "!ASAHI KASEI CORPORATION"         0        138.213.33.28    gb       "UK-MICROSOFT-19900530"             0        1        0x01      1          0x00000000_0x00000008_0x0008  0x00000000  0                  1819
A     1876     0x0400000200004000  1022171722.772690000  1022171722.785414000  0.012724000  1           3        eth:ipv4:icmp  00:d0:02:6d:78:00  00:50:da:37:f6:03  0x0800           193.133.161.22  gb       "Verizon UK Limited"               0        138.212.191.75   jp       "!ASAHI KASEI CORPORATION"          0        1        0x01      9          0x00000000_0x00000008_0x0008  0x00000000  0                  1876
B     1876     0x0400000200004001  1022171702.597916000  1022171702.597916000  0.000000000  1           3        eth:ipv4:icmp  00:50:da:37:f6:03  00:d0:02:6d:78:00  0x0800           138.212.191.75  jp       "!ASAHI KASEI CORPORATION"         0        193.133.161.22   gb       "Verizon UK Limited"                0        1        0x01      1          0x00000000_0x00000008_0x0008  0x00000000  0                  1876
A     1905     0x0400000200004001  1022171702.623420000  1022171702.623420000  0.000000000  1           3        eth:ipv4:icmp  00:d0:02:6d:78:00  00:50:fc:44:99:fd  0x0800           201.74.106.234  br       "Claro NXT Telecomunicacoes Ltda"  0        138.212.187.11   jp       "!ASAHI KASEI CORPORATION"          0        1        0x01      1          0x00000000_0x00000008_0x0008  0x00000000  0                  1905
The bitfields are useful for selecting flows, but if you like a bit more human readability, set ICMP_TC_MD to 0, recompile and rerun t2, as indicated below:
t2conf icmpDecode -D ICMP_TC_MD=1 && t2build icmpDecode
t2 -r ~/data/annoloc2.pcap -w ~/results
tawk '$icmpTCcnt > 0 || hdr()' ~/results/annoloc2_flows.txt | head -n 15 | tcol
%dir  flowInd  flowStat            timeFirst             timeLast              duration     numHdrDesc  numHdrs  hdrDesc        srcMac             dstMac             ethType  vlanID  srcIP           srcIPCC  srcIPOrg                           srcPort  dstIP            dstIPCC  dstIPOrg                            dstPort  l4Proto  icmpStat  icmpTCcnt  icmpBFTypH_TypL_Code          icmpTmGtw   icmpEchoSuccRatio  icmpPFindex
A     59       0x0400000200004001  1022171701.692762000  1022171701.692762000  0.000000000  1           3        eth:ipv4:icmp  00:80:48:b3:22:ef  00:d0:02:6d:78:00  0x0800           138.212.187.10  jp       "!ASAHI KASEI CORPORATION"         0        201.116.148.149  mx       "Gestión de direccionamiento Uni"   0        1        0x01      1          0x00000000_0x00000008_0x0008  0x00000000  0                  59
A     893      0x0400000200004001  1022171701.812425000  1022171701.812425000  0.000000000  1           3        eth:ipv4:icmp  00:80:48:d7:ed:7a  00:d0:02:6d:78:00  0x0800           138.212.189.88  jp       "!ASAHI KASEI CORPORATION"         0        201.116.161.83   mx       "UNINET"                            0        1        0x01      1          0x00000000_0x00000008_0x0008  0x00000000  0                  893
A     1069     0x0400000200004001  1022171701.889357000  1022171701.889357000  0.000000000  1           3        eth:ipv4:icmp  00:48:54:7a:04:0f  00:d0:02:6d:78:00  0x0800           138.212.184.71  jp       "!ASAHI KASEI CORPORATION"         0        146.208.9.41     us       "!Keysight Technologies"            0        1        0x01      1          0x00000000_0x00000008_0x0008  0x00000000  0                  1069
A     1177     0x0400000200004001  1022171701.956543000  1022171701.956543000  0.000000000  1           3        eth:ipv4:icmp  00:d0:02:6d:78:00  00:80:48:b3:22:c4  0x0800           201.118.86.105  mx       "!Gestión de direccionamiento Un"  0        138.212.189.66   jp       "!ASAHI KASEI CORPORATION"          0        1        0x01      1          0x00000000_0x00000008_0x0002  0x00000000  0                  1177
A     1204     0x0400000200004001  1022171701.980834000  1022171701.980834000  0.000000000  1           3        eth:ipv4:icmp  00:d0:02:6d:78:00  00:80:48:b3:22:c4  0x0800           138.213.40.91   gb       "UK-MICROSOFT-19900530"            0        138.212.189.66   jp       "!ASAHI KASEI CORPORATION"          0        1        0x01      1          0x00000000_0x00000008_0x0008  0x00000000  0                  1204
A     1232     0x0400000200004001  1022171702.009674000  1022171702.009674000  0.000000000  1           3        eth:ipv4:icmp  00:48:54:7a:04:0f  00:d0:02:6d:78:00  0x0800           138.212.184.71  jp       "!ASAHI KASEI CORPORATION"         0        36.237.77.156    tw       "Chunghwa Telecom Co,Ltd HINET-NE"  0        1        0x01      1          0x00000000_0x00000008_0x0008  0x00000000  0                  1232
A     1557     0x0400000200004001  1022171702.247453000  1022171702.247453000  0.000000000  1           3        eth:ipv4:icmp  00:04:76:22:07:90  00:d0:02:6d:78:00  0x0800           138.212.186.88  jp       "!ASAHI KASEI CORPORATION"         0        201.19.77.72     br       "V tal"                             0        1        0x01      1          0x00000000_0x00000008_0x0008  0x00000000  0                  1557
A     1572     0x0400000200004001  1022171702.265015000  1022171702.265015000  0.000000000  1           3        eth:ipv4:icmp  00:08:a1:1d:3f:f1  00:d0:02:6d:78:00  0x0800           138.212.191.25  jp       "!ASAHI KASEI CORPORATION"         0        19.50.144.156    us       "!Ford Motor Company"               0        1        0x01      1          0x00000000_0x00000008_0x0008  0x00000000  0                  1572
A     1717     0x0400000200004001  1022171702.396273000  1022171702.396273000  0.000000000  1           3        eth:ipv4:icmp  00:80:48:b3:24:eb  00:d0:02:6d:78:00  0x0800           138.212.190.25  jp       "!ASAHI KASEI CORPORATION"         0        19.6.20.159      us       "!Ford Motor Company"               0        1        0x01      1          0x00000000_0x00000008_0x0008  0x00000000  0                  1717
A     1740     0x0400000200004001  1022171702.417049000  1022171702.417049000  0.000000000  1           3        eth:ipv4:icmp  00:80:48:b3:22:ef  00:d0:02:6d:78:00  0x0800           138.212.187.10  jp       "!ASAHI KASEI CORPORATION"         0        65.171.40.80     us       "COGENT-174"                        0        1        0x01      1          0x00000000_0x00000008_0x0008  0x00000000  0                  1740
A     1749     0x0400000200004001  1022171702.423157000  1022171702.423157000  0.000000000  1           3        eth:ipv4:icmp  00:80:48:b3:22:ef  00:d0:02:6d:78:00  0x0800           138.212.187.10  jp       "!ASAHI KASEI CORPORATION"         0        193.108.29.243   lv       "LV-LMT"                            0        1        0x01      1          0x00000000_0x00000008_0x0008  0x00000000  0                  1749
A     1819     0x0400000200004001  1022171702.510250000  1022171702.510250000  0.000000000  1           3        eth:ipv4:icmp  00:80:48:b3:22:ef  00:d0:02:6d:78:00  0x0800           138.212.187.10  jp       "!ASAHI KASEI CORPORATION"         0        138.213.33.28    gb       "UK-MICROSOFT-19900530"             0        1        0x01      1          0x00000000_0x00000008_0x0008  0x00000000  0                  1819
A     1876     0x0400000200004000  1022171722.772690000  1022171722.785414000  0.012724000  1           3        eth:ipv4:icmp  00:d0:02:6d:78:00  00:50:da:37:f6:03  0x0800           193.133.161.22  gb       "Verizon UK Limited"               0        138.212.191.75   jp       "!ASAHI KASEI CORPORATION"          0        1        0x01      9          0x00000000_0x00000008_0x0008  0x00000000  0                  1876
B     1876     0x0400000200004001  1022171702.597916000  1022171702.597916000  0.000000000  1           3        eth:ipv4:icmp  00:50:da:37:f6:03  00:d0:02:6d:78:00  0x0800           138.212.191.75  jp       "!ASAHI KASEI CORPORATION"         0        193.133.161.22   gb       "Verizon UK Limited"                0        1        0x01      1          0x00000000_0x00000008_0x0008  0x00000000  0                  1876
Now you see the sequence of code 3 separated by ; in flow 1876.
As an exercise try to extract all flows and packets (t2 -s option) having icmpStat=0x20 set.
Add layer 2/4 information
Information about MACs and ports which helps you decoding certain number can be added:
| macRecorder | records all MAC pairs during a connection, packet counts and MAC decoding |
| portClassifier | human readable ports |
Unload icmpDecode and protoStats, then load both plugins:
t2build -u icmpDecode protoStats
t2build macRecorder portClassifier tcpStates
t2 -r ~/data/annoloc2.pcap -w ~/results================================================================================ Tranalyzer 0.9.4 (Anteater), Cobra. PID: 22656, SID: 666 ================================================================================ Date: 1751610685.000390107 sec (Fri 04 Jul 2025 08:31:25 CEST) [INF] Creating flows for L2, IPv4, IPv6 Active plugins: 01: basicFlow, 0.9.4 02: macRecorder, 0.9.4 03: portClassifier, 0.9.4 04: tcpStates, 0.9.4 05: txtSink, 0.9.4 ...
In the flow file below, you will now see from the macRecorder plugin all MAC addresses including packet counts per flow. If redundant routing is presents you will see minimum two MAC pairs per flow. It is also useful to detect broken network cards, then you see several random MAC pairs. In the case of redundant routing, the packet counts should be almost equal. If this is not the case, then something is wrong.
Moreover the manufacturer/protocol is listed by default, so that the user does not need to look it up on the web. The portClassifier is somewhat misleading, as it does not really classifies, but instead transforms the port number into a human readable string, such as https for port 443 in our case.
head -n 14 ~/results/annoloc2_flows.txt | tcol
%dir  flowInd  flowStat            timeFirst             timeLast              duration     numHdrDesc  numHdrs  hdrDesc       srcMac             dstMac             ethType  vlanID  srcIP            srcIPCC  srcIPOrg                            srcPort  dstIP            dstIPCC  dstIPOrg                            dstPort  l4Proto  macStat  macPairs  srcMac_dstMac_numP                     srcMacLbl_dstMacLbl        dstPortClassN  dstPortClass  tcpStatesAFlags
A     265      0x0400000000004000  1022171701.709116000  1022171701.709116000  0.000000000  1           3        eth:ipv4:tcp  00:d0:02:6d:78:00  00:50:fc:0e:21:56  0x0800           209.171.12.143   ca       "TELUS Communications"              4987     138.212.185.230  jp       "!ASAHI KASEI CORPORATION"          41250    6        0x00     1         00:d0:02:6d:78:00_00:50:fc:0e:21:56_1  DITECHCOR,US_EdimaxTec,TW  41250          unknown       0xc3
A     447      0x0400000000004000  1022171701.721366000  1022171701.721366000  0.000000000  1           3        eth:ipv4:tcp  00:d0:02:6d:78:00  00:50:fc:3b:62:78  0x0800           217.41.129.13    gb       "BT-MIDBAND"                        58872    138.212.187.186  jp       "!ASAHI KASEI CORPORATION"          80       6        0x00     1         00:d0:02:6d:78:00_00:50:fc:3b:62:78_1  DITECHCOR,US_EdimaxTec,TW  80             http          0xc3
A     392      0x0400000000004000  1022171701.716998000  1022171701.716998000  0.000000000  1           3        eth:ipv4:tcp  00:d0:02:6d:78:00  00:50:bf:59:85:48  0x0800           36.242.181.230   jp       "SOFTBANK Corp"                     4685     138.212.188.67   jp       "!ASAHI KASEI CORPORATION"          1214     6        0x00     1         00:d0:02:6d:78:00_00:50:bf:59:85:48_1  DITECHCOR,US_Metallige,TW  1214           kazaa         0x03
B     392      0x0400000000004001  1022171701.732313000  1022171701.732313000  0.000000000  1           3        eth:ipv4:tcp  00:50:bf:59:85:48  00:d0:02:6d:78:00  0x0800           138.212.188.67   jp       "!ASAHI KASEI CORPORATION"          1214     36.242.181.230   jp       "SOFTBANK Corp"                     4685     6        0x00     1         00:50:bf:59:85:48_00:d0:02:6d:78:00_1  Metallige,TW_DITECHCOR,US  1214           kazaa         0x43
A     906      0x0400000000004000  1022171701.816638000  1022171701.816638000  0.000000000  1           3        eth:ipv4:tcp  00:d0:02:6d:78:00  00:60:08:69:80:dd  0x0800           161.135.53.11    us       "FedEx"                             5001     138.212.191.94   jp       "!ASAHI KASEI CORPORATION"          80       6        0x00     1         00:d0:02:6d:78:00_00:60:08:69:80:dd_1  DITECHCOR,US_3com,US       80             http          0x03
B     906      0x0400000000004001  1022171701.817195000  1022171701.817195000  0.000000000  1           3        eth:ipv4:tcp  00:60:08:69:80:dd  00:d0:02:6d:78:00  0x0800           138.212.191.94   jp       "!ASAHI KASEI CORPORATION"          80       161.135.53.11    us       "FedEx"                             5001     6        0x00     1         00:60:08:69:80:dd_00:d0:02:6d:78:00_1  3com,US_DITECHCOR,US       80             http          0x43
A     1027     0x0400000000004000  1022171701.872817000  1022171701.872817000  0.000000000  1           3        eth:ipv4:tcp  00:d0:02:6d:78:00  00:80:48:b3:13:27  0x0800           146.162.158.230  gb       "!Norwich Union Insurance Limited"  2849     138.212.184.193  jp       "!ASAHI KASEI CORPORATION"          6346     6        0x00     1         00:d0:02:6d:78:00_00:80:48:b3:13:27_1  DITECHCOR,US_COMPEXINC,US  6346           gnutella-svc  0x03
B     1027     0x0400000000004001  1022171701.873426000  1022171701.873426000  0.000000000  1           3        eth:ipv4:tcp  00:80:48:b3:13:27  00:d0:02:6d:78:00  0x0800           138.212.184.193  jp       "!ASAHI KASEI CORPORATION"          6346     146.162.158.230  gb       "!Norwich Union Insurance Limited"  2849     6        0x00     1         00:80:48:b3:13:27_00:d0:02:6d:78:00_1  COMPEXINC,US_DITECHCOR,US  6346           gnutella-svc  0x43
A     1154     0x0400000000004000  1022171701.939627000  1022171701.939627000  0.000000000  1           3        eth:ipv4:tcp  00:d0:02:6d:78:00  00:50:bf:59:85:48  0x0800           193.133.224.57   gb       "Verizon UK Limited"                3286     138.212.188.67   jp       "!ASAHI KASEI CORPORATION"          1214     6        0x00     1         00:d0:02:6d:78:00_00:50:bf:59:85:48_1  DITECHCOR,US_Metallige,TW  1214           kazaa         0x03
B     1154     0x0400000000004001  1022171701.947575000  1022171701.947575000  0.000000000  1           3        eth:ipv4:tcp  00:50:bf:59:85:48  00:d0:02:6d:78:00  0x0800           138.212.188.67   jp       "!ASAHI KASEI CORPORATION"          1214     193.133.224.57   gb       "Verizon UK Limited"                3286     6        0x00     1         00:50:bf:59:85:48_00:d0:02:6d:78:00_1  Metallige,TW_DITECHCOR,US  1214           kazaa         0x43
A     867      0x0400000200004000  1022171701.805350000  1022171701.805350000  0.000000000  1           3        eth:ipv4:tcp  00:60:b0:b5:da:10  00:d0:02:6d:78:00  0x0800           138.212.184.48   jp       "!ASAHI KASEI CORPORATION"          6666     36.74.248.27     id       "PT TELKOM INDONESIA"               1108     6        0x00     1         00:60:b0:b5:da:10_00:d0:02:6d:78:00_1  HewlettPa,US_DITECHCOR,US  1108           ratio-adp     0x03
B     867      0x0400000000004001  1022171702.012658000  1022171702.012658000  0.000000000  1           3        eth:ipv4:tcp  00:d0:02:6d:78:00  00:60:b0:b5:da:10  0x0800           36.74.248.27     id       "PT TELKOM INDONESIA"               1108     138.212.184.48   jp       "!ASAHI KASEI CORPORATION"          6666     6        0x00     1         00:d0:02:6d:78:00_00:60:b0:b5:da:10_1  DITECHCOR,US_HewlettPa,US  1108           ratio-adp     0x43
A     864      0x0400000200004000  1022171701.805329000  1022171702.066438000  0.261109000  1           3        eth:ipv4:tcp  00:d0:02:6d:78:00  00:60:b0:ec:34:27  0x0800           19.54.241.65     us       "!Ford Motor Company"               6667     138.212.191.209  jp       "!ASAHI KASEI CORPORATION"          45891    6        0x00     1         00:d0:02:6d:78:00_00:60:b0:ec:34:27_3  DITECHCOR,US_HewlettPa,US  45891          unknown       0x03
Often it is cumbersome to interpret the meaning behind certain MACs, or for training sessions a quick identifier of MAC addresses might be useful. This topic and manufacturer labeling will be discussed in tutorial MAC labeling.
Now you got a quick insight into the basic plugins. You can now start using T2 on your own pcaps or look into other tutorials about specifics e.g. traffic mining, or content
plugins. Don’t forget to reset all the plugins into the default mode and recompile.
Here is the t2conf command to reset the core and all plugins:
t2conf --reset -a && t2build -R
Have fun!!
Operational mode switching: ETH, IPv4/6, SCTP
T2 can operate in several operational modes. The default is dual IP stack (IPv4 and IPv6) and L2 Ethernet flow production. In order to accelerate T2, it can be switched into IPv4 or IPv6 mode or into a plain L2 flow/packet producer depending on your demands or your network.
Search for USER CONFIGURATION FLAGS in networkHeaders.h and have a look at the default settings:
tranalyzer2
vi src/networkHeaders.h
...
/* ========================================================================== */
/* ------------------------ USER CONFIGURATION FLAGS ------------------------ */
/* ========================================================================== */

#define IPV6_ACTIVATE     2 // 0: IPv4 only
                            // 1: IPv6 only
                            // 2: dual mode

#define ETH_ACTIVATE      1 // 0: No L2 flows,
                            // 1: Activate L2 flows,
                            // 2: Also use Ethernet addresses for IPv4/6 flows

#define LAPD_ACTIVATE     0 // 0: No LAPD/Q.931 flows
                            // 1: Activate LAPD/Q.931 flow generation

#define SCTP_ACTIVATE     0 // activate SCTP streams -> flows
#define SCTP_STATFINDEX   1 // 0: findex increments
                            // 1: findex constant for all SCTP streams in a packet

#define MULTIPKTSUP       0 // multi-packet suppression

#define T2_PRI_HDRDESC    1 // keep track of the headers traversed
#define T2_HDRDESC_AGGR   1 // aggregate repetitive headers, e.g., vlan{2}
#define T2_HDRDESC_LEN  128 // max length of the headers description

/* ========================================================================== */
/* ------------------------- DO NOT EDIT BELOW HERE ------------------------- */
/* ========================================================================== */
...
Moreover SCTP to flow transformation is supported. Which is by default disabled, because it requires
additional code the standard admin does not need. The researcher or protocol expert might need that
functionality, so set SCTP_ACTIVATE to 1. The constant SCTP_STATFINDEX controls whether all SCTP
streams are sorted into several flows with the same flow index or different incrementing flow indexes.
Compile all plugins, as you may have plugins which implement the SCTP flow segregation, e.g., sctpDecode.
t2conf tranalyzer2 -D SCTP_ACTIVATE=1 && t2build -R
Now run t2 with your SCTP pcap or run it on an interface where SCTP traffic is present.
For more details, refer to the SCTP tutorial.
Note that since version 0.8.14 T2 also supports flow production for Link Access Procedure for the D-Channel (LAPD),
if the LAPD_ACTIVATE switch is 1. Then the Anteater processes also abis protocols, which makes him mobile
protocol capable. Special plugins will follow here.
Flow hash autopilot: overload protection
Yes, the Anteater has an autopilot for flow hash managment. The amount of hash and flow space can be allocated in the core, which will be discussed in Hash chain table size, hash autopilot, hash functions For most of the applications in research the default config is sufficient. If you process a really large pcap NOW with millions of flows/s then you expect the following warning:
[WRN] Hash Autopilot: main HashMap full: flushing 1 oldest flow(s)!
[INF] Hash Autopilot: Fix: Invoke Tranalyzer with '-f value'
T2 sees the end of free flow space coming, drops the oldes flow and continues. Note the -f value.
You can interrupt the anteater by typing the Ctrl+C combination twice.
Then you can restart it with the proposed -f value added to the commandline and sufficient flow and hash space will be allocated.
Now you got a quick insight into the basic T2 functionality, plugin operations and workflow. You can now start using T2 on your own pcaps or look into other tutorials about specifics of your interest.
Have fun!!